How can analyzing data on the use of transportation services in different parts of Austin help identify opportunities for improving accessibility and equity in the transportation system?
Analyzing data on the use of transportation services in different parts of Austin can help identify areas where there may be disparities in access to transportation options. This can help identify areas where there may be a lack of transportation services or where transportation options may not be adequately meeting the needs of certain groups of people.
For example, the data may show that certain neighborhoods have lower rates of public transportation usage compared to other areas, which could indicate a lack of access to transportation services in those neighborhoods. By identifying these disparities, city planners and transportation agencies can take steps to improve the accessibility and equity of the transportation system in Austin. This could involve increasing the availability of public transportation services in underserved areas, providing additional support for people with disabilities, or implementing other strategies to ensure that everyone has access to the transportation options they need.
How can analyzing data on the use of transportation services at different times of day in Austin to identify opportunities for improving the availability and reliability of transportation options?
Analyzing data on the use of transportation services at different times of day in Austin can help identify potential opportunities for improving the availability and reliability of transportation options. This data can be used to understand when demand for transportation services is highest and when there may be gaps in service availability.
For example, the data may show that there is a high demand for public transportation during morning and evening rush hours, but a lower demand during off-peak hours. By understanding this data, city planners and transportation agencies can take steps to improve the availability and reliability of transportation options in Austin. This could involve increasing the frequency of public transportation services during peak hours, implementing dynamic pricing for ride-sharing services to encourage more drivers to be available during high-demand periods, or implementing other strategies to ensure that transportation options are available when people need them.
How does analyzing data on the use of transportation services by different cultural and ethnic groups in Austin help us better understand the transportation needs of diverse communities?
Analyzing data on the use of transportation services by different cultural and ethnic groups in Austin can help us better understand the unique transportation needs of diverse communities. This data can be used to identify trends and patterns in the use of different modes of transportation by different cultural and ethnic groups.
For example, the data may show that certain cultural or ethnic groups are more likely to use public transportation, while others are more likely to use ride-sharing services or other transportation options. By understanding these trends and patterns, city planners and transportation agencies can take steps to ensure that the transportation system in Austin is meeting the needs of all of the city’s residents, regardless of their cultural or ethnic background. This could involve implementing targeted outreach and engagement strategies to ensure that diverse communities are aware of available transportation options and have access to the information and support they need to use the transportation system effectively.
Analyzing data on the use of transportation services by different cultural and ethnic groups in Austin can help us better understand the transportation needs of diverse communities by providing valuable insights into how these communities use transportation services. This information can be used to identify any disparities or inequities in access to transportation services among different cultural and ethnic groups, and can help policymakers and other stakeholders develop strategies to address these issues and ensure that all members of the community have access to the transportation they need.
How does data analytics help different occupations and job sectors in Austin with identifying opportunities to support economic growth and development?
Data analytics can help different occupations and job sectors in Austin identify opportunities to support economic growth and development by providing valuable insights into the state of the local economy and key trends and patterns that can be leveraged to support economic growth.
By analyzing data on various economic indicators, such as employment rates, income levels, and consumer spending patterns, businesses and organizations can gain a better understanding of the local market and identify opportunities for growth. This information can be used to inform strategic decision-making, such as where to invest resources, what products or services to offer, and how to market to potential customers. Additionally, data analytics can help identify potential challenges or obstacles to economic growth and development, and can be used to develop strategies to overcome these challenges and support a thriving local economy.
How can analyzing data on the usage of transportation services by different education levels in Austin help us identify opportunities for promoting access to education and training?
Analyzing data by different education levels in Austin can help us identify opportunities for promoting access to education and training by providing valuable insights into the state of education in the city.
This information can be used to identify any disparities or inequities in access to education among different education levels, and can help policymakers and other stakeholders develop strategies to address these issues and ensure that all members of the community have access to the education and training they need. Additionally, data analytics can help identify potential trends or patterns in education and training, such as high demand for certain skills or fields, that can be leveraged to promote access to education and support economic growth and development in the city.
How can analyzing data on the usage of transportation services by different income levels in Austin help identify opportunities for reducing income inequality and improving social mobility?
We can use data on different income levels in Austin to identify opportunities for reducing income inequality and improving social mobility by analyzing the distribution of income within the city.
This information can be used to identify any disparities or inequities in income among different groups, and can help policymakers and other stakeholders develop strategies to address these issues and promote income equality and social mobility.
For example, data analytics can help identify neighborhoods or communities with high levels of income inequality, which can be targeted for specific interventions or programs aimed at reducing inequality and improving social mobility.
Additionally, data analytics can help identify potential trends or patterns in income, such as changes in the distribution of income over time, that can be used to inform policy decisions and support efforts to reduce income inequality and improve social mobility in the city.
How can analyzing data on the usage of transportation services by different age groups in Austin help identify opportunities for promoting healthy aging and active living?
Analyzing data on the usage of transportation services by different age groups in Austin can help identify opportunities for promoting healthy aging and active living by providing valuable insights into how older adults in the city use transportation services.
This information can be used to identify any disparities or inequities in access to transportation among different age groups, and can help policymakers and other stakeholders develop strategies to address these issues and ensure that older adults have access to the transportation they need to maintain an active, healthy lifestyle.
Additionally, data analytics can help identify potential trends or patterns in the use of transportation services by older adults, such as changes in the types of transportation used over time, that can be leveraged to promote healthy aging and active living in the city.
How can analyzing data on the usage of transportation services by different language groups in Austin help identify opportunities for promoting linguistic diversity and inclusivity?
Analyzing data on the usage of transportation services by different language groups in Austin can help identify opportunities for promoting linguistic diversity and inclusivity by providing valuable insights into how different language groups in the city use transportation services.
This information can be used to identify any disparities or inequities in access to transportation among different language groups, and can help policymakers and other stakeholders develop strategies to address these issues and ensure that all members of the community have access to the transportation they need, regardless of their primary language.
Additionally, data analytics can help identify potential trends or patterns in the use of transportation services by different language groups, such as changes in the types of transportation used over time, that can be leveraged to promote linguistic diversity and inclusivity in the city.
One potential use case for analyzing data on the usage of transportation services by different language groups in Austin is to develop targeted outreach and engagement strategies that are tailored to the needs of specific language communities. This could include providing information and resources about transportation options in languages other than English, as well as offering language assistance for individuals who may need help accessing transportation services.
By making transportation more accessible and inclusive for language minority communities, policymakers and other stakeholders can promote linguistic diversity and support the integration of these communities into the broader Austin community.
Another potential use case for analyzing data on the usage of transportation services by different language groups in Austin is to inform the design and planning of transportation infrastructure and services.
By understanding the transportation needs and preferences of different language groups, transportation planners can develop transportation systems that better serve the needs of the entire community, including language minority communities. This could include designing transportation systems that are more accessible and user-friendly for individuals with limited English proficiency, or implementing targeted programs and services that support the transportation needs of language minority communities.
By incorporating the perspectives and experiences of different language groups into transportation planning, policymakers and other stakeholders can promote linguistic diversity and inclusivity in the city.
How can analyzing data on the usage of transportation services by different geographic areas in Austin to identify opportunities for promoting regional collaboration and connectivity?
Analyzing data on the usage of transportation services in different areas of Austin can be like a detective trying to solve a mystery. Just like a detective gathers clues and pieces together a story to solve a crime, analyzing transportation data can help uncover patterns and insights that can be used to improve regional collaboration and connectivity in Austin.
For example, the data might show that certain areas have high demand for public transportation, while others have a need for more bike-sharing options.
By identifying these opportunities, transportation officials can work together with different areas in Austin to develop solutions that improve connectivity and make it easier for people to get around the city. Like a detective bringing a criminal to justice, analyzing transportation data can help improve the lives of people in Austin by making it easier for them to get where they need to go.
Analyzing transportation data can help identify areas with high demand for public transportation, such as buses and trains, and inform the development of new routes or increased frequency of service.
The data can also highlight areas with a need for more bike-sharing options, allowing officials to work with local businesses and organizations to expand these services.
By understanding the transportation patterns and needs of different areas in Austin, officials can better allocate resources and develop strategies to improve connectivity and reduce traffic congestion.
For example, the data might show that certain areas have a high number of commuters who drive alone, suggesting the potential for carpooling initiatives or other programs to promote alternative modes of transportation.
In addition, analyzing transportation data can help identify opportunities for regional collaboration, such as connecting different public transportation systems or developing joint initiatives to improve accessibility and mobility for all residents of Austin.
How can analyzing data on the usage of transportation services related to different family oriented structures in Austin help identify opportunities for promoting family-friendly policies and services?
Analyzing data on the usage of transportation services related to different family-oriented structures in Austin can help identify opportunities for promoting family-friendly policies and services. For example, the data might show that certain areas have a high number of families with young children, indicating a need for more accessible and convenient transportation options for parents and kids.
This could include things like dedicated bus lanes for school buses, expanded bike-sharing programs, or increased frequency of public transportation during peak hours when parents are commuting with their children.
By understanding the transportation needs of families in different areas of the city, officials can develop targeted policies and services that make it easier for parents to get around with their kids and support their daily activities. In addition, analyzing data on the usage of transportation services by families can also help identify potential opportunities for promoting alternative modes of transportation, such as carpooling or using ride-sharing services, which can reduce traffic congestion and improve the overall mobility of families in Austin.
Analyzing data on the use of transportation services…
by different lifestyle groups in Austin to identify opportunities for promoting healthy and sustainable living.
by different types of businesses and industries in Austin to identify opportunities for promoting economic development and job creation.
by different religious and spiritual communities in Austin to identify opportunities for promoting religious tolerance and diversity.
by different social and cultural groups in Austin to identify opportunities for promoting cultural exchange and diversity.
by different sports and recreational activities in Austin to identify opportunities for promoting healthy living and active lifestyles.
by different health care providers and facilities in Austin to identify opportunities for promoting access to health care and wellness services.
by different arts and cultural organizations in Austin to identify opportunities for promoting cultural vitality and creativity.
by different environmental organizations and groups in Austin to identify opportunities for promoting sustainability and eco-friendliness.
by different community organizations and groups in Austin to identify opportunities for promoting community engagement and participation.
by different arts and cultural organizations in Austin to identify opportunities for promoting cultural tourism and economic development.
by different community organizations and groups in Austin to identify opportunities for promoting community involvement and engagement.
by different arts and cultural organizations in Austin to identify opportunities for promoting cultural vibrancy and diversity.
by different environmental organizations and groups in Austin to identify opportunities for promoting environmental conservation and stewardship.
by different community organizations and groups in Austin to identify opportunities for promoting community involvement and engagement.
by different arts and cultural organizations in Austin to identify opportunities for promoting cultural tourism and economic development.
by different social justice organizations and groups in Austin to identify opportunities for promoting social justice and equality.
by different social media and online platforms in Austin to identify opportunities for promoting digital connectivity and inclusion.
There are many ways that data analytics can be used to improve transportation in Austin.
For example, data analytics can be used to better understand traffic patterns and identify bottlenecks or other areas where traffic flow is hindered.
This information can then be used to improve traffic flow and reduce congestion on the roads. Additionally, data analytics can be used to optimize public transportation routes and schedules, making it easier for people to get where they need to go. This can also help to reduce traffic congestion, as more people are likely to use public transportation if it is more convenient and efficient. By using data analytics to improve transportation in Austin, it is possible to create a more efficient and effective transportation system that benefits both residents and visitors.
Another way that data analytics can be used to improve transportation in Austin is by helping to identify areas where transportation infrastructure needs to be improved. For example, data analytics can be used to analyze the number of accidents that occur at a particular intersection, or the amount of congestion on a particular stretch of road. This information can then be used to prioritize infrastructure improvements and allocate resources where they are most needed.
Additionally, data analytics can be used to improve the overall transportation experience for people in Austin. For example, data analytics can be used to provide real-time information about traffic conditions and public transportation schedules, making it easier for people to plan their trips and avoid delays. This information can be made available through a variety of channels, such as websites, mobile apps, and digital signs at bus stops and other locations.
Overall, data analytics has the potential to play a major role in improving transportation in Austin by providing valuable insights and information that can be used to make the transportation system more efficient, effective, and convenient for all. By leveraging the power of data analytics, it is possible to create a transportation system that meets the needs of Austin’s growing population and helps to support the city’s continued growth and development.
Here’s 50 ways data analytics can be used to improve Austin Texas traffic or any city around the world..
Using data analytics to identify traffic bottlenecks and improve traffic flow in Austin.
Analyzing public transportation data to optimize routes and schedules.
Using data analytics to improve the efficiency of ride-sharing services in Austin.
Analyzing traffic accident data to identify areas where transportation infrastructure needs to be improved.
Using data analytics to provide real-time traffic information to drivers in Austin.
Analyzing public transportation usage data to identify trends and patterns.
Using data analytics to improve the planning of new transportation projects in Austin.
Analyzing data on bike usage in Austin to identify areas where bike infrastructure can be improved.
Using data analytics to improve the efficiency of public transportation by reducing wait times and improving on-time performance.
Analyzing data on the use of electric and hybrid vehicles in Austin to better understand their impact on the transportation system.
Using data analytics to track and monitor the performance of transportation infrastructure in Austin, such as roads, bridges, and tunnels.
Analyzing data on public transportation ridership to identify factors that influence the use of public transportation in Austin.
Using data analytics to improve the integration of different modes of transportation in Austin, such as buses, trains, and ride-sharing services.
Analyzing data on traffic congestion in Austin to identify potential solutions and strategies for reducing congestion.
Using data analytics to improve the accessibility of transportation options for people with disabilities in Austin.
Analyzing data on the use of public transportation by different demographic groups in Austin to better understand the transportation needs of the city’s residents.
Using data analytics to improve the availability of real-time information about transportation options in Austin, such as bus schedules and traffic conditions.
Analyzing data on the environmental impact of the transportation system in Austin to identify opportunities for reducing emissions and improving air quality.
Using data analytics to improve the safety of the transportation system in Austin by identifying and addressing potential hazards and risks.
Analyzing data on the economic impact of the transportation system in Austin to identify opportunities for creating jobs and boosting the local economy.
Using data analytics to improve the planning and coordination of large-scale transportation projects in Austin, such as the construction of new roads or the expansion of public transportation systems.
Analyzing data on the use of public transportation by tourists and visitors to Austin to better understand their transportation needs and preferences.
Using data analytics to improve the reliability and performance of the transportation system in Austin by identifying and addressing potential issues and problems.
Analyzing data on the use of different transportation modes in Austin to identify opportunities for promoting sustainable and environmentally-friendly transportation options.
Using data analytics to improve the customer experience of using the transportation system in Austin by providing personalized and relevant information and services to riders.
Analyzing data on the use of transportation services;
Using data analytics to improve the communication and coordination between different transportation agencies and stakeholders in Austin to ensure a smooth and efficient transportation system.
Analyzing data on the use of public transportation by different income groups in Austin to better understand the transportation needs of low-income residents.
Using data analytics to improve the monitoring and maintenance of the transportation infrastructure in Austin to ensure its longevity and effectiveness.
Using data analytics to improve the integration of transportation services with other city services in Austin, such as public parks, schools, and libraries.
Analyzing data on the use of public transportation by seniors and other age groups in Austin to identify opportunities for improving accessibility and support for older residents.
Using data analytics to improve the planning and coordination of transportation services for special events in Austin, such as festivals, concerts, and sporting events.
Analyzing data on the use of different transportation modes in Austin to identify opportunities for encouraging the use of more sustainable and eco-friendly options.
Using data analytics to improve the integration of transportation services with other cities and regions in the Austin area to create a more cohesive and effective transportation network.
Analyzing data on the use of public transportation by different gender groups in Austin to identify opportunities for promoting gender equality in the transportation system.
Using data analytics to improve the availability and affordability of transportation services for low-income residents in Austin.
Using data analytics to improve the integration of transportation services with other forms of technology in Austin, such as smart phones and smart city systems.
Using data analytics to improve the coordination and collaboration between different transportation agencies and organizations in Austin to create a more seamless and efficient transportation system.
Using data analytics to improve the coordination and integration of transportation services with other urban planning and development initiatives in Austin.
Using data analytics to improve the accessibility and affordability of transportation services for students and other young people in Austin.
Using data analytics to improve the coordination and integration of transportation services with other public health initiatives in Austin, such as promoting active transportation and reducing air pollution.
Using data analytics to improve the availability and accessibility of transportation services for people living in rural and remote areas of Austin.
Using data analytics to improve the coordination and integration of transportation services with other environmental initiatives in Austin, such as promoting green infrastructure and reducing greenhouse gas emissions.
Using data analytics to improve the coordination and integration of transportation services with other public safety initiatives in Austin, such as promoting road safety and reducing crime.
Using data analytics to improve the coordination and integration of transportation services with other public education initiatives in Austin, such as promoting access to education and training.
Using data analytics to improve the availability and reliability of transportation services during;
major events and gatherings in Austin, such as concerts, festivals, and sporting events.
extreme weather conditions in Austin.
major holidays and special occasions in Austin.
high-demand periods and peak travel times in Austin.
Analyzing data on the use of transportation services by different environmental organizations and groups in Austin to identify opportunities for promoting environmental conservation and stewardship.
Using data analytics to improve the coordination and integration of transportation services with other public education initiatives in Austin, such as promoting access to quality education and training.
Using data analytics to improve the coordination and integration of transportation services with other public health initiatives in Austin, such as promoting
healthy eating and active living.
affordable and accessible housing options.
emergency preparedness and disaster response.
Analyzing data on the use of transportation services by different community organizations and groups in Austin to identify opportunities for promoting community involvement and engagement.
It is important to note that data analytics is only one tool that can be used to improve transportation in Austin. In order to effectively use data analytics to improve transportation, it is essential to have a clear understanding of the challenges and opportunities facing the transportation system in Austin, as well as the goals and priorities of the city and its residents. Additionally, it is important to have the right data, technology, and expertise in place to effectively collect, analyze, and use transportation data. Finally, it is essential to have the support and cooperation of various stakeholders, including transportation agencies, local businesses, community organizations, and city officials, in order to implement effective solutions based on the insights and information provided by data analytics. By combining data analytics with other strategies and approaches, it is possible to create a more efficient, effective, and sustainable transportation system in Austin that meets the needs of the city and its residents.
There are several steps you can take to improve the performance of your ETL processes. These include optimizing the data extraction and transformation steps, using parallel processing and data partitioning, and implementing efficient data loading techniques.
One of the key ways to improve the performance of your ETL processes is to optimize the data extraction and transformation steps. This can involve identifying and addressing bottlenecks in the process, such as slow-running queries or complex transformations, and implementing techniques to improve their performance. For example, you can use indexing and partitioning to improve the performance of data extraction, and you can use parallel processing and in-memory technologies to improve the performance of data transformation.
Another effective way to improve the performance of your ETL processes is to use parallel processing and data partitioning. This involves dividing the data into smaller chunks, and processing each chunk independently and in parallel. This can help to improve the overall speed and performance of the ETL process, as it allows you to take advantage of the processing power of multiple machines or cores.
In addition, you can improve the performance of your ETL processes by implementing efficient data loading techniques. This can involve using bulk loading and other high-speed loading methods, and optimizing the target database or data warehouse for efficient data loading. This can help to reduce the time and resources required to load the data, and can improve the overall performance of the ETL process.
We understand there are many steps you can take to improve the performance of your ETL processes. By optimizing the data extraction and transformation steps, using parallel processing and data partitioning, and implementing efficient data loading techniques, you can improve the speed and efficiency of your ETL processes, and support better data integration and analysis.
Several other best practices you can follow to improve the performance of your ETL processes.
These include leveraging in-memory technologies, implementing real-time ETL, and using a data lake as a central repository for your data.
One effective way to improve the performance of your ETL processes is to leverage in-memory technologies. In-memory technologies, such as in-memory databases and in-memory data grids, allow you to store and process data in memory, rather than on disk. This can significantly improve the performance of your ETL processes, as it allows you to access and manipulate data much faster than with traditional disk-based storage systems.
Another best practice for improving the performance of your ETL processes is to implement real-time ETL. This involves using real-time data streams, rather than batch-oriented ETL processes, to extract, transform, and load data. This can help to improve the speed and accuracy of your ETL processes, as it allows you to process data as it is generated, rather than in periodic batches.
Finally, you can improve the performance of your ETL processes by using a data lake as a central repository for your data. A data lake is a large, scalable, and flexible data storage repository that allows you to store and process data in its raw, unstructured form. By using a data lake as the central repository for your data, you can improve the performance and scalability of your ETL processes, and support more efficient and effective data integration and analysis.
Overall, there are many best practices you can follow to improve the performance of your ETL processes. By leveraging in-memory technologies, implementing real-time ETL, and using a data lake, you can improve the speed and efficiency of your ETL processes, and support better data integration and analysis.
Broader strategies and best practices you can use to improve the performance of your ETL processes.
These include:
Conducting regular performance analysis and optimization: Regularly analyzing and optimizing your ETL processes can help to identify and address performance bottlenecks and inefficiencies. This can involve using monitoring and performance analysis tools to track the performance of your ETL processes, and then implementing changes and improvements based on the results of the analysis.
Leveraging the latest technologies and techniques: The field of ETL is constantly evolving, and new technologies and techniques are being developed all the time. By staying up-to-date with the latest developments, you can take advantage of new technologies and techniques that can improve the performance of your ETL processes.
Collaborating with other teams and stakeholders: ETL is often a cross-functional process, involving data engineers, data analysts, and business users. By collaborating with these teams and stakeholders, you can gain a better understanding of their needs and requirements, and can design and implement ETL processes that are well-suited to their needs.
Continuously learning and improving: The field of ETL is complex and dynamic, and it is important to stay up-to-date with the latest developments and best practices. By continuously learning and improving, you can develop the skills and knowledge needed to effectively design and implement ETL processes that support your data integration and analysis needs.
Overall, there are many strategies and best practices you can use to improve the performance of your ETL processes. By adopting these strategies and techniques, you can improve the speed and efficiency of your ETL processes, and support better data integration and analysis.
ETL (Extract, Transform, Load) plays a critical role in data integration and data management. ETL is a process that involves extracting data from various sources, transforming it into a format that is suitable for analysis, and loading it into a target database or data warehouse. This process is commonly used to integrate data from multiple sources into a single, centralized repository, making it easier to access and analyze the data.
In a data integration context, ETL is used to bring data from multiple sources together into a single, consistent format. This can involve extracting data from transactional databases, flat files, and other systems, and then transforming it to ensure that it is in a consistent format and ready for analysis. The transformed data is then loaded into a target database or data warehouse, where it can be accessed and analyzed by data analysts and business users.
In a data management context, ETL plays a key role in ensuring the quality and integrity of the data. As part of the transformation process, ETL tools can be used to clean and normalize the data, removing duplicates and inconsistencies, and ensuring that the data is accurate and complete. This is essential for supporting data-driven decision making, as it ensures that the data is reliable and can be trusted.
Overall, ETL plays a vital role in data integration and data management, by providing a means of extracting and transforming data from multiple sources, and loading it into a target database or data warehouse. By using ETL, organizations can integrate data from multiple sources, ensuring that it is consistent and ready for analysis, and can support data-driven decision making.
In addition to its role in data integration and data management, ETL can also support other key business processes and activities.
For example, ETL can be used to support data migration and consolidation, by extracting data from legacy systems and loading it into a new, centralized data repository. This can be an effective way to modernize and streamline data management processes, and to support the integration of acquired companies or businesses.
ETL can also be used to support data quality and governance initiatives, by providing a means of identifying and addressing issues with the data, such as missing or incorrect values. This can help to ensure that the data is accurate and reliable, and can be trusted by data analysts and business users.
In addition, ETL can support the development of data-driven applications and services, by providing a means of extracting and transforming data, and loading it into a target system in a format that can be easily accessed and consumed by the application. This can be an effective way to support the development of data-driven products and services, and to enable organizations to leverage their data assets more effectively.
Overall, the role of ETL in data integration and data management is critical, and it is an essential component of any data warehousing or business intelligence strategy. By leveraging ETL, organizations can integrate data from multiple sources, ensuring its quality and consistency, and support data-driven decision making and innovation.
When choosing an ETL tool for your business, there are several factors to consider. These include the specific needs of your business, the type and volume of data you need to process, and the resources and skills available to support the tool.
One of the key considerations is the type and volume of data you need to process. Different ETL tools have different capabilities in terms of the volume and complexity of data they can handle. For example, some tools are designed to handle large volumes of data, while others are better suited for smaller datasets. If you have a large amount of data to process, you will need a tool that can handle the scale and complexity of your data.
Another important consideration is the specific needs of your business. Different businesses have different requirements when it comes to ETL, and it is important to choose a tool that can support your specific needs. For example, if you need to integrate data from multiple sources, you will need a tool that can handle multiple data inputs. If you need to perform complex transformations on your data, you will need a tool that has advanced transformation capabilities.
In addition to these factors, you should also consider the resources and skills available to support the tool. Different ETL tools require different levels of technical expertise and support, and it is important to choose a tool that aligns with the skills and resources available in your organization. If you have a team of data engineers with advanced technical skills, you may be able to choose a more complex and powerful tool. If your team has more limited technical expertise, you may need to choose a tool that is easier to use and requires less support.
Choosing the right ETL tool for your business involves considering a range of factors, including the type and volume of data you need to process, the specific needs of your business, and the resources and skills available to support the tool. By carefully considering these factors, you can select an ETL tool that is well-suited to your business and can support your data integration and analysis needs.
Once you have considered the key factors and identified a shortlist of potential ETL tools, it can be helpful to conduct a trial or pilot project to evaluate the tools more fully.
This can involve setting up a small-scale ETL process using the tools on your shortlist, and then testing and comparing their performance and capabilities.
During the trial, you can evaluate the tools against a range of criteria, including their ability to handle the volume and complexity of your data, the ease of use and support required, and the overall performance and reliability of the tool. You can also involve key stakeholders in the trial, such as data analysts and business users, to get their feedback on the tools and their suitability for your needs.
Based on the results of the trial, you can then make an informed decision about which ETL tool to choose. It is important to consider not only the technical capabilities of the tool, but also the overall fit with your business and the resources and skills available to support it.
Once you have selected an ETL tool, it is important to ensure that it is properly implemented and supported within your organization. This can involve providing training and support to relevant staff, and establishing processes and procedures for using and maintaining the tool. By taking these steps, you can ensure that your ETL tool is used effectively and efficiently, and can support your data integration and analysis needs.
We have accomplished another milestone in our software, Canopys. Canopys v0.1.1 is coming soon, and I’m here to explain more about the application, the update, and the future.
Our software, canopies v0.1.0, is available on both Mac and Windows.
Also, we made Mac and Windows files available on the website; no sign is required to download the file. The sign-up is nested into Auth0, which handles all of our authentication. This is a significant step toward offering a file and gaining information from end users safely; we can’t see Auth0’s software managing any end users’ passwords and 100% of this.
We like auth0 for user authentication because it offers us a chance to focus on the product, not building and supporting a custom authentication solution, and this allows us to continue to drive innovations in the areas we feel are most important to growth.
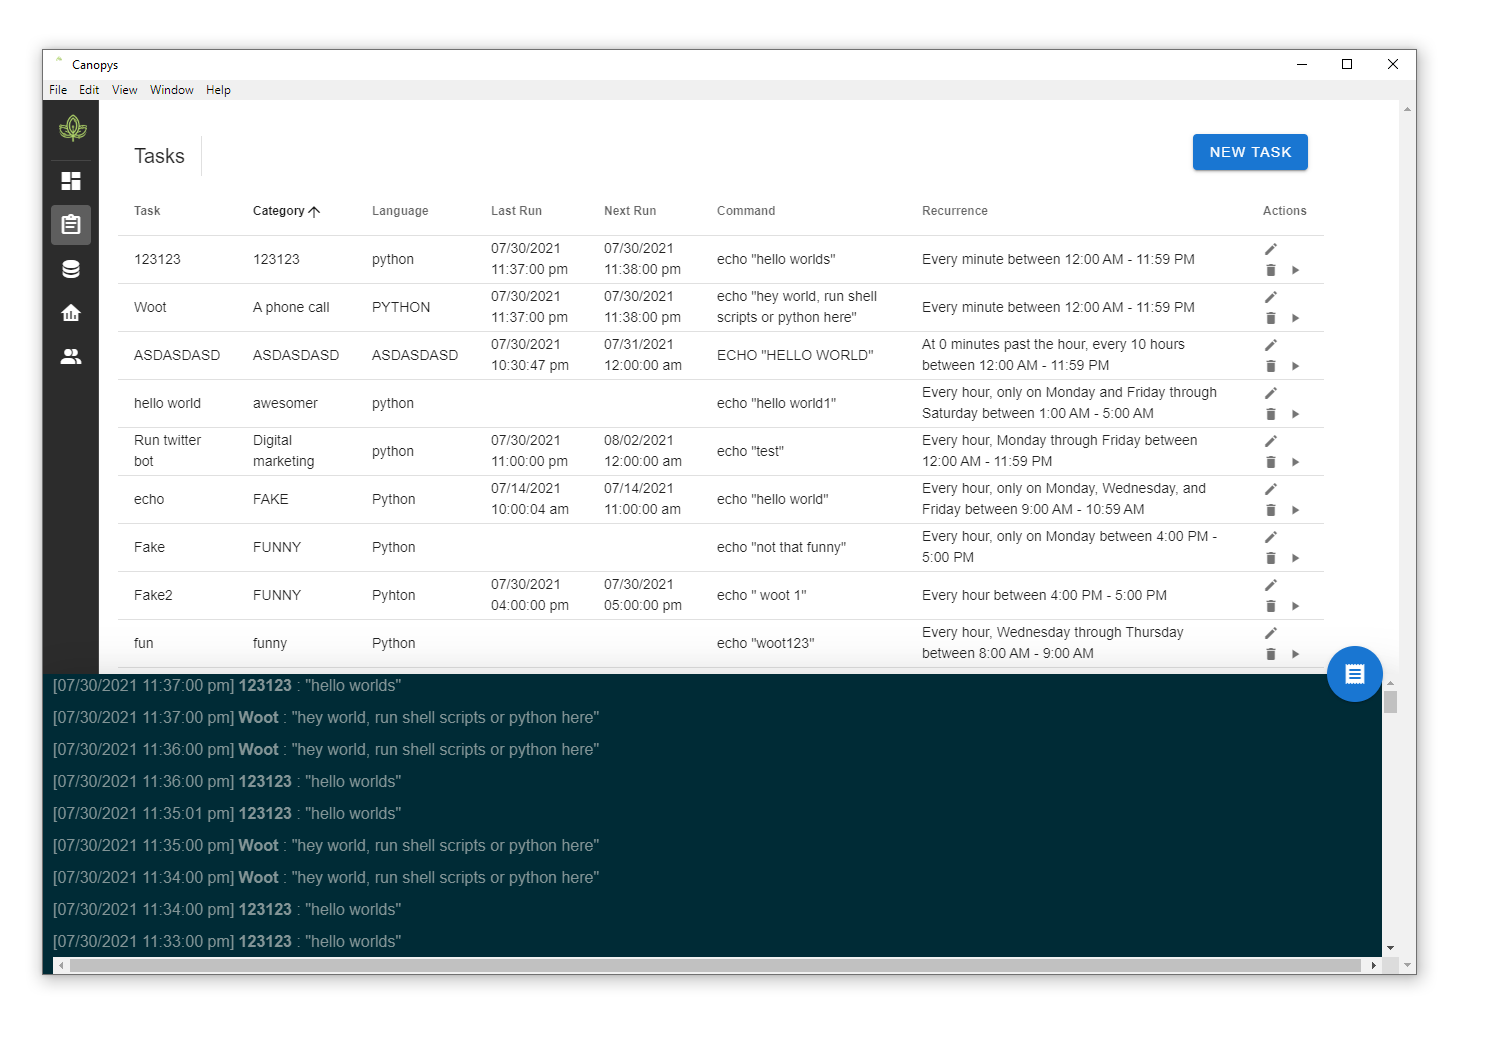
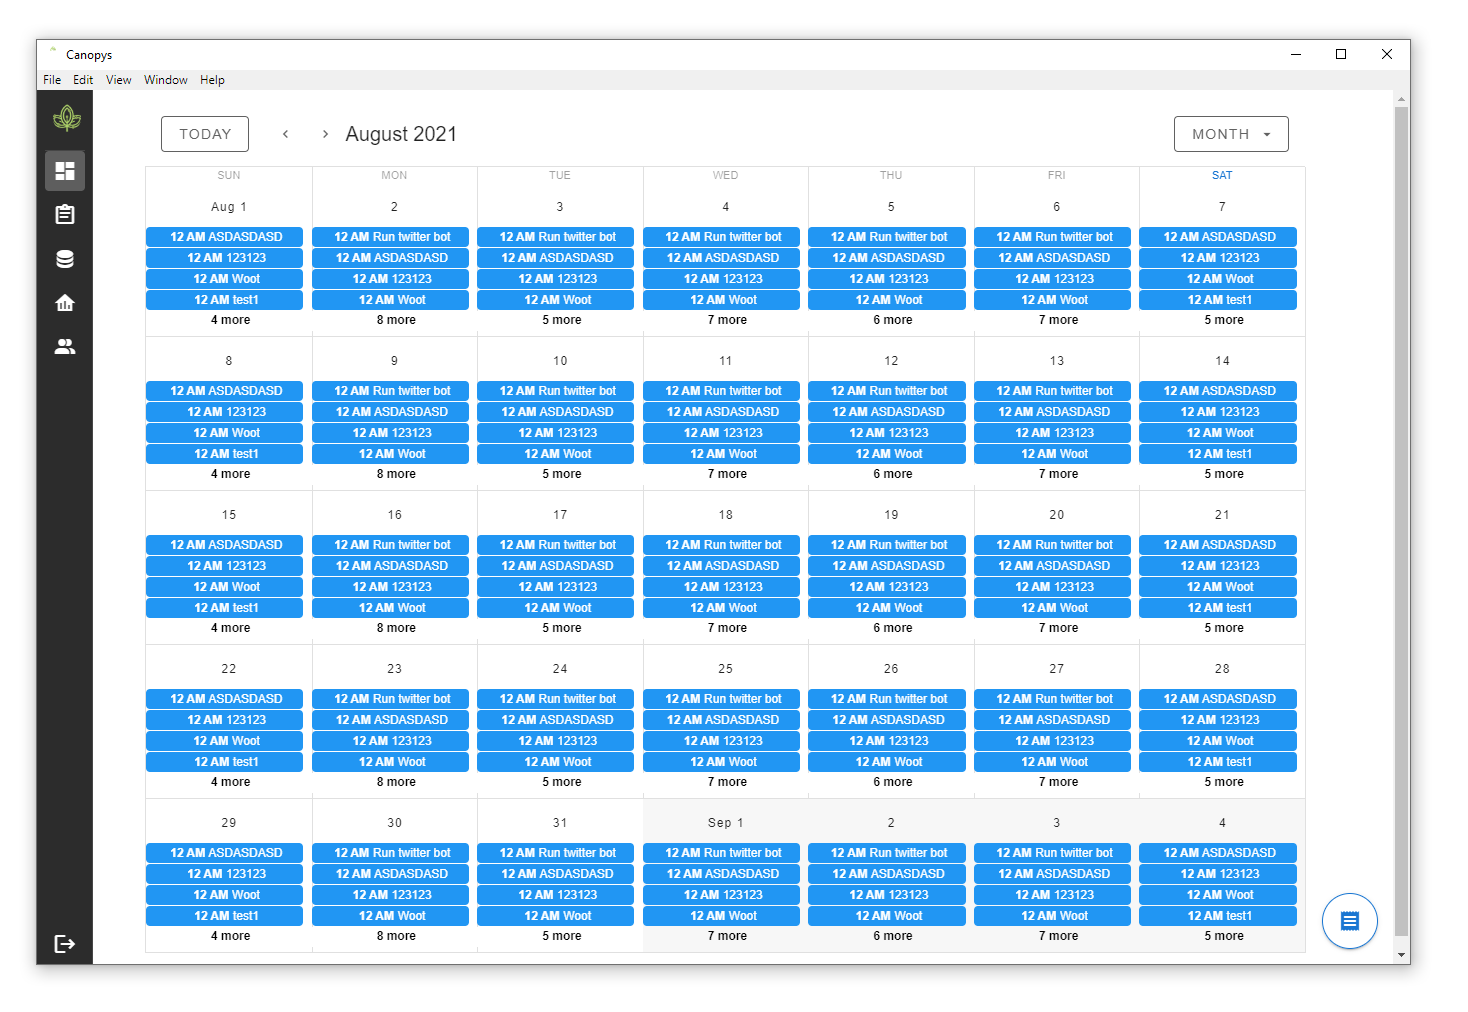
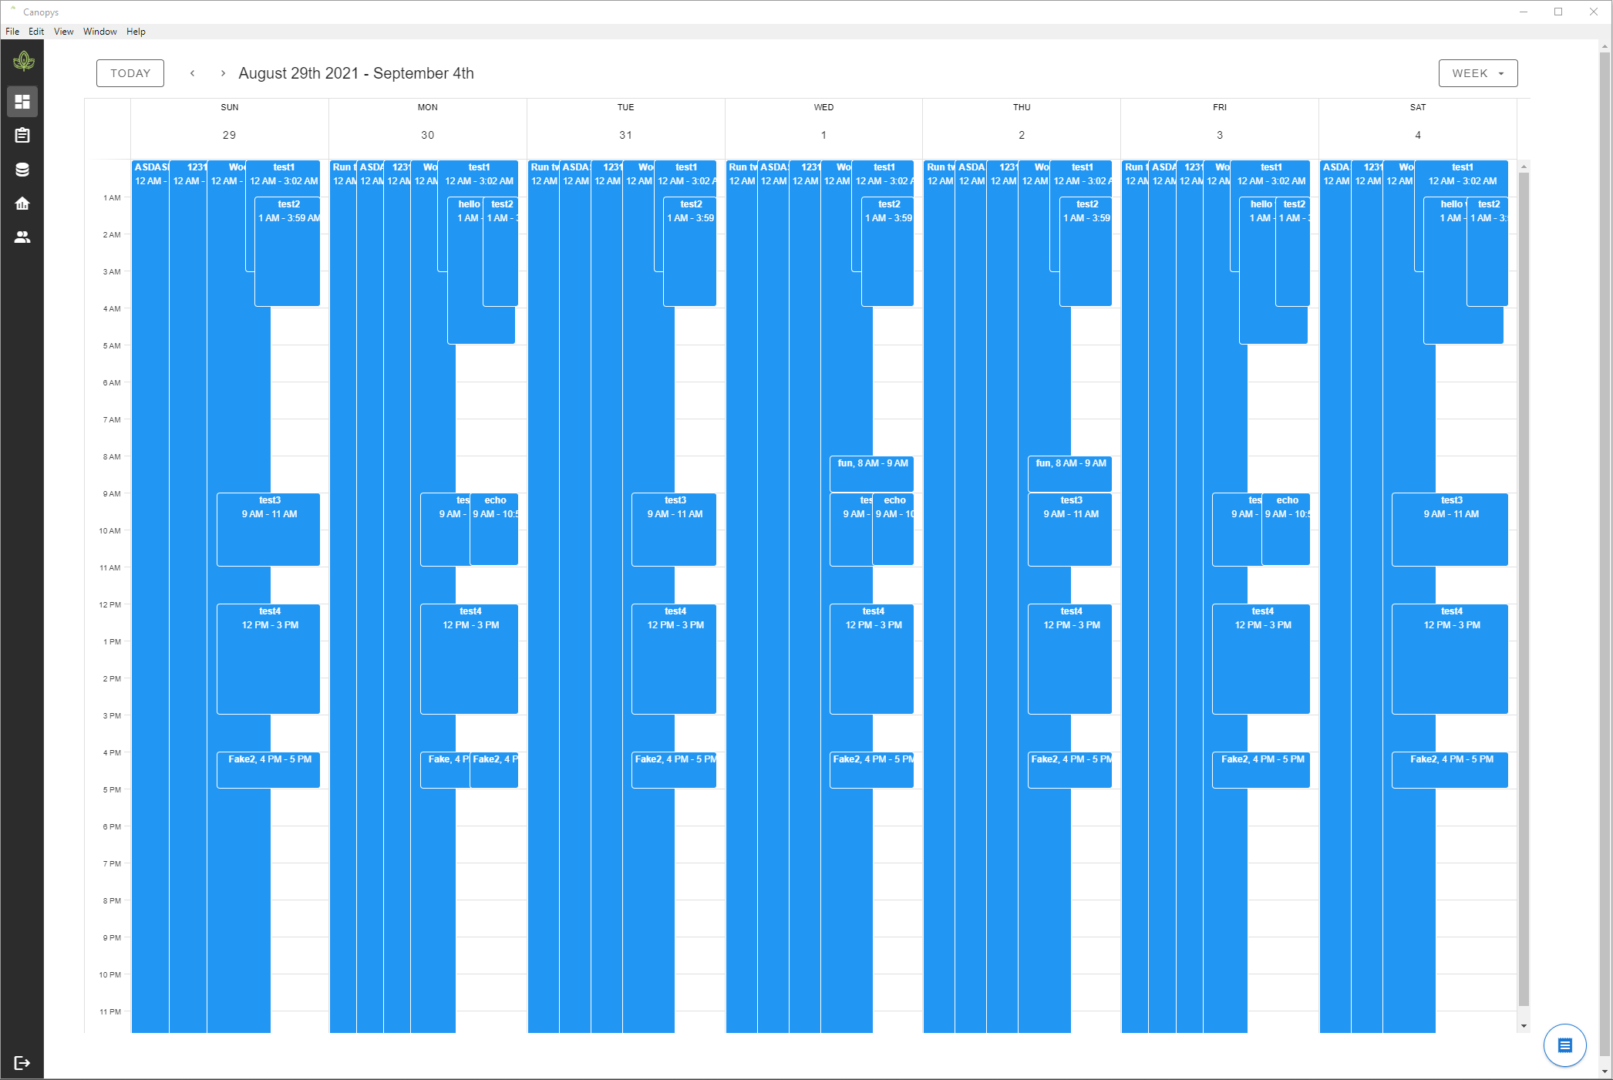
Before we release the next version, please test our Canopys 0.1.0 Task Scheduler and a Calendar view similar to Google Calendar. Let us know what you think!
I know what you’re thinking: this sure beats Windows Task Scheduler, and that’s one of the many reasons we built this solution. We wanted to offer a more straightforward workflow for generating a scheduled event.
Canopy Update v0.1.1 Details
We are adding two major apps to Canopys: Data Hub and Data Viz. This means we now have a complete deployment solution. Task schedule, data storage, and analytics. All in one application.
Here’s a list of details we are adding.
Adding data hub
Adding data viz
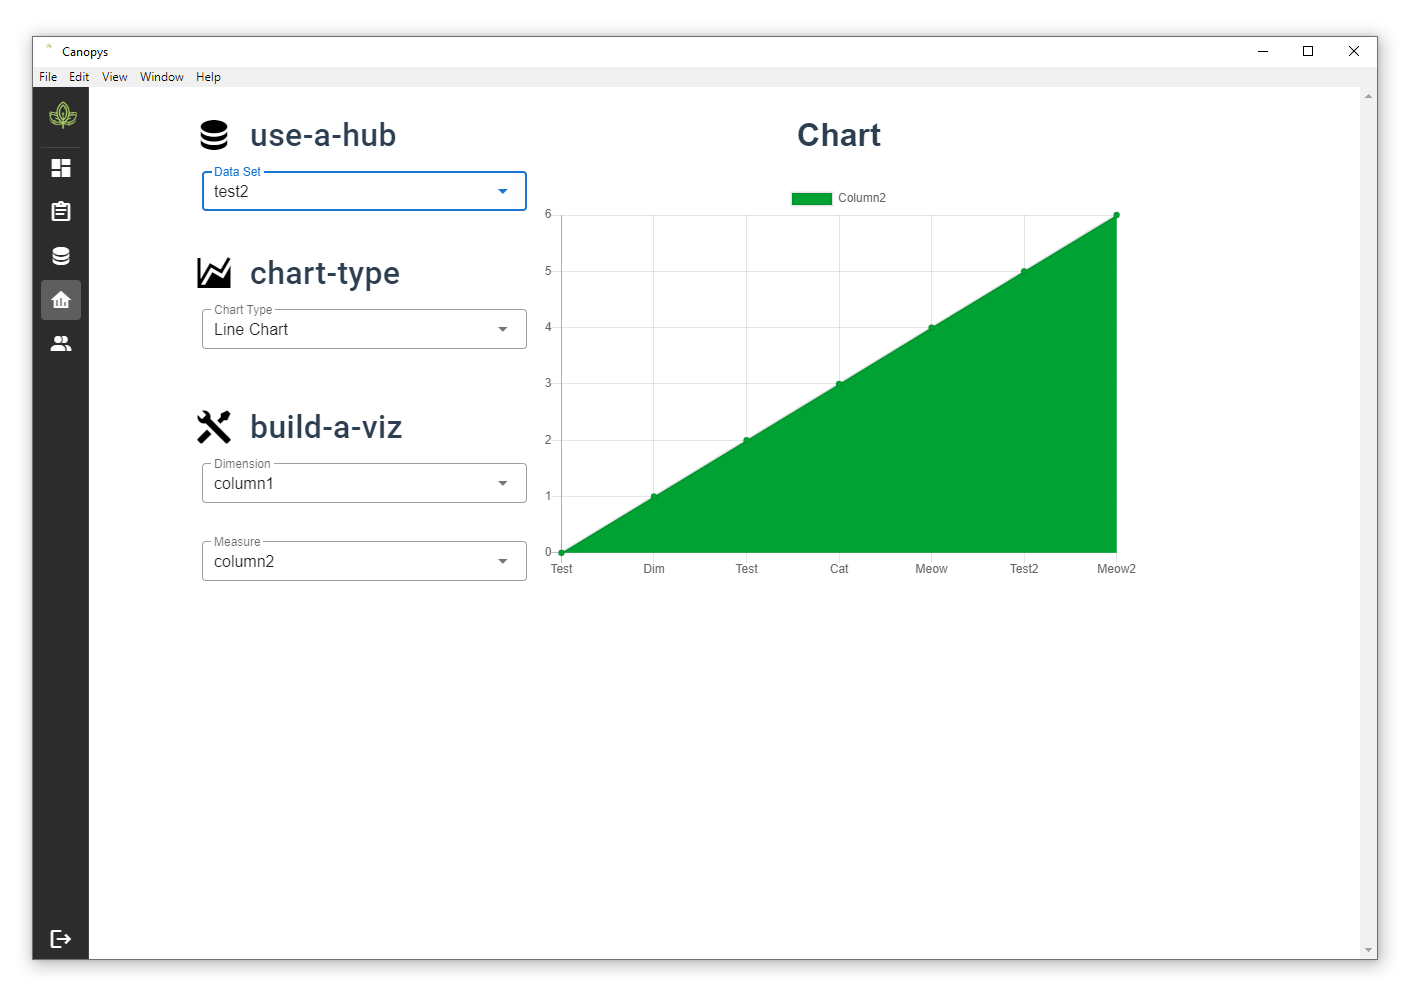
Adding two charts, a line chart and a pie chart
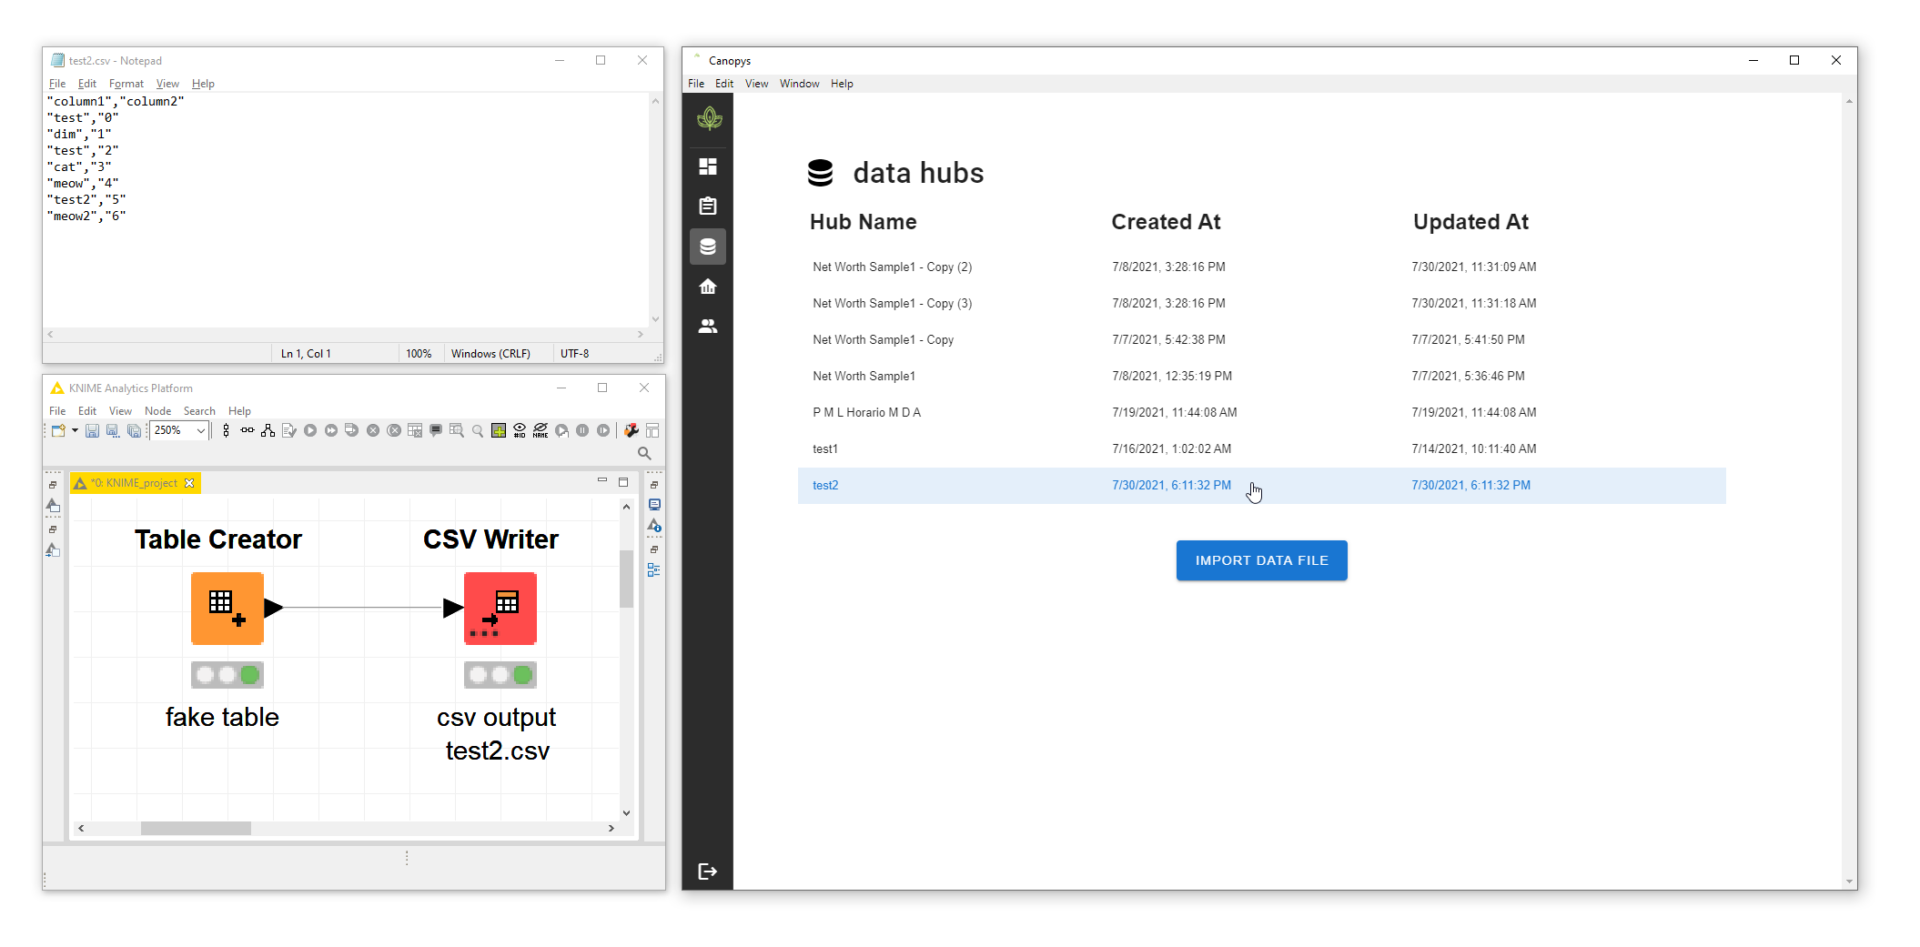
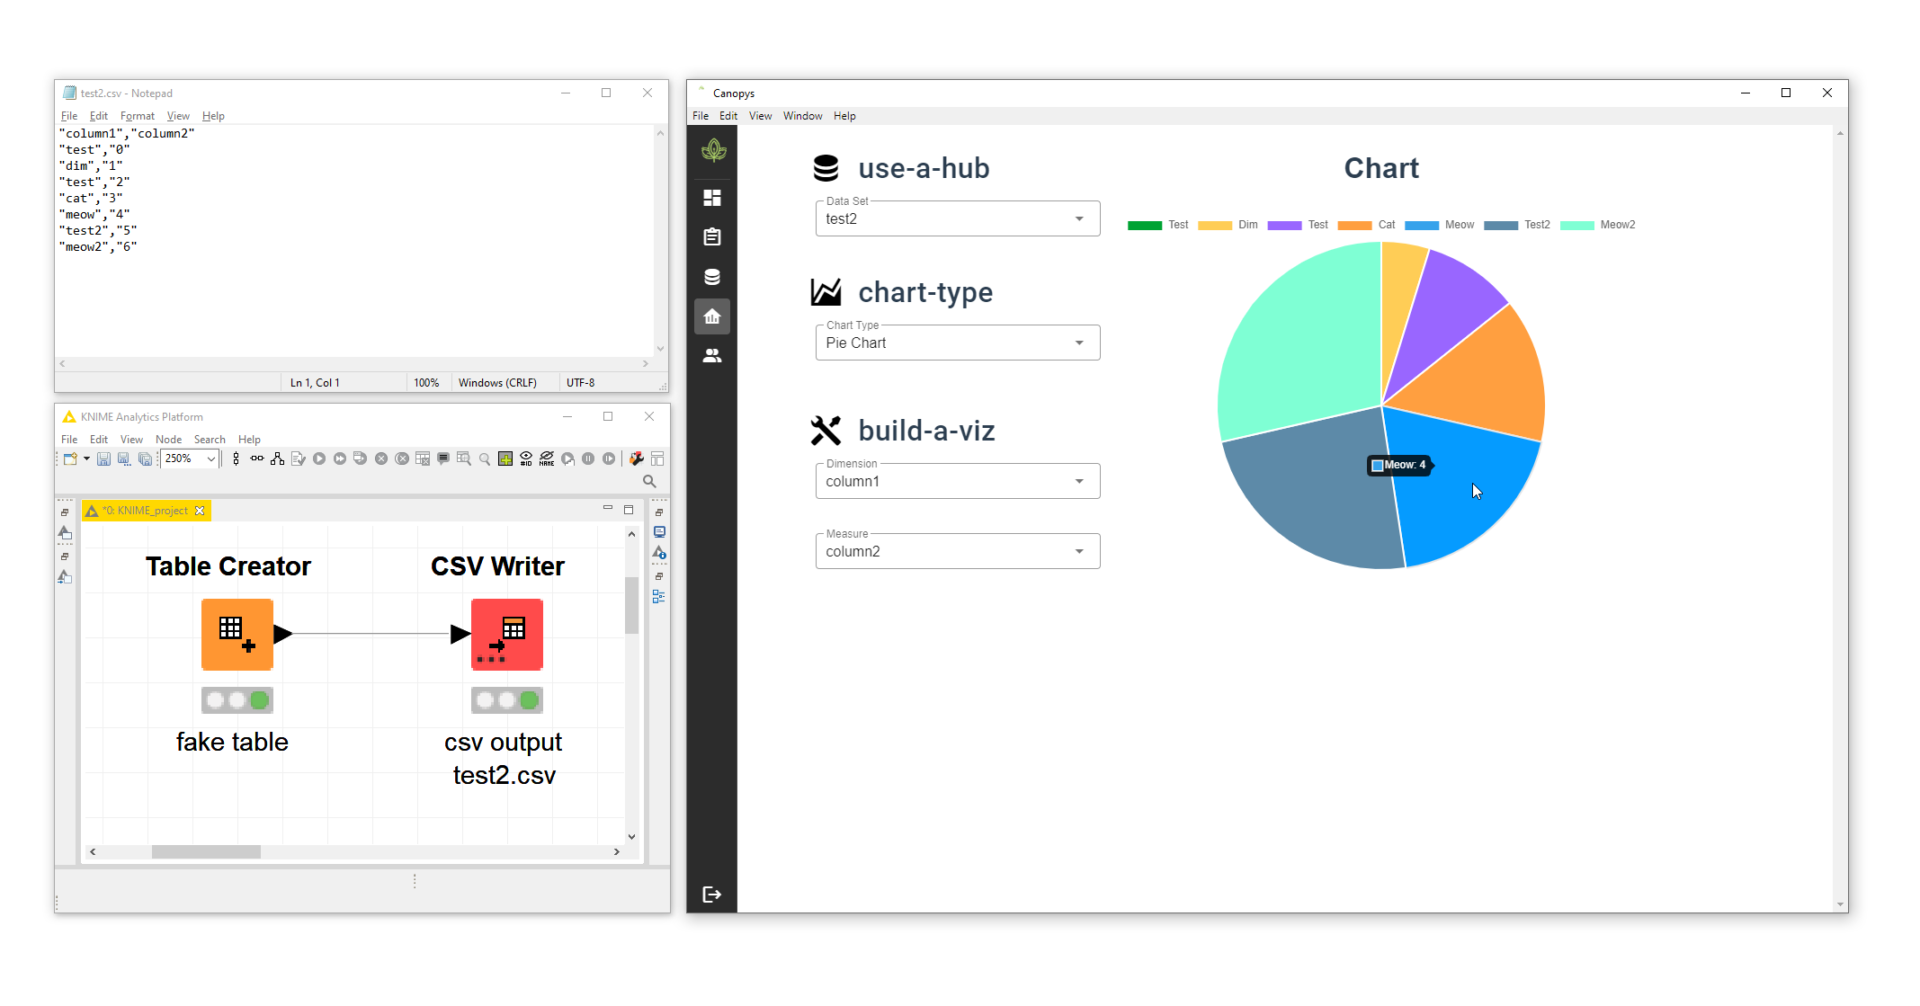
The data hub connects data to visualizations. Look how we offer data storage with one button. It accepts JSON and CSV files. We do not plan on increasing the data inputs because we do not want to be a data connector development company.
A demo of data hubs.
After the data is stored in Canopys, you can build charts immediately. Data hubs feed your analytics; everything is contained in this one application. Data Viz is where we are demoing the creation of a chart. In the future, this area will be different.
A demo of data viz, with a pie chart!Demo of a line chart.
Below, please find more about the future of Canopys and FAQ.
FAQ and Future Thoughts for Canopy
How will Canopys offer Collaboration? The ultimate objective with any analytics application is sharing it with someone else and embedding the chart in the web or app. We know our perspective on this ‘requirement’ will begin molding how people solve problems, allowing us to change how people solve problems.
What does the future hold? In the future, there will be a place to build multiple visualizations, and we are making a means of sharing these assets or data hubs with your teammates or clients.
Our team of engineers, my wife and I included, are all video game players, and we are building what we believe is a video game version of tech we have grown to love and adopt.
We aim to generate a user-friendly multiple-player video game in a realm of highly complex single-player video games. This video game does not require a certificate or engineering degree to be successful.
Are we adding more charts? Yes, that’s the plan. We are looking at KPI charts next. Once we have 4 or 5 visualizations or charts, we will be devoting all of our focus to the more prominent features we want to ensure we do correctly.