DEV3LOPCOM, LLC | SOFTWARE CONSULTING
Ideas to Reality
Through software consulting services we help clients bring their ideas into reality. Like adding security, persistence, visualization and storage to your solutions. 100% USA based consultants, founded in 2016. We build custom, from end-to-end, and train your team. Ship applications in hours, not months.
Dev3lop is the right choice for a company of any size.
I would highly recommend Dev3lop to anyone seeking technical help.
His easy-going attitude made it very enjoyable to work along.
WE MAKE APPS AND WEAR MANY HATS
We are a software consultancy based in Austin Texas, and everyone wears a lot of hats. DEV3LOPCOM, LLC helps from idea to production. Experienced assisting clients with SaaS software implementations, gap analysis, building custom data engineering solutions, full-stack engineering, design, diagramming, and much more.
LEARN ABOUT OUR APPLICATION
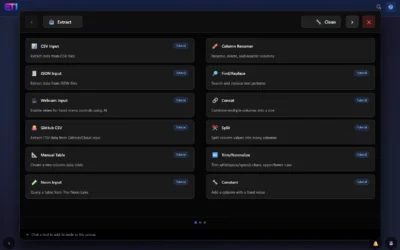
ET1.1 Training Menu Update
We have overhauled our original menu in ET1.1 to improve the adoption of the software and ease of usage. We've completely redesigned the node menu to now be a source of knowledge. The Training Menu in ET1 makes learning about data transformation tools faster, attaches...
ET1.1 Change Log | Version #1
Never have I ever tried to reverse engineer figjam! However once I was done, I realized there's a lot more within my grasp. Hey everyone, ET1.1 has come a long way, we have a free ETL version of ET1 that's available online, plus ET1 code on github (very trendy) and...
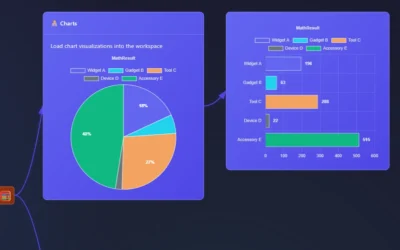
ET1.1 Charts Node
In ET1.1 Neon you can now pipeline your data to Charts. Pie Chart Donut Chart Polar Chart Bar Chart This covers an array of classic data visualizations and the same highlighting functionally flows through from data grid to charts. Making it the first ETL software that...
ET1.1 Neon Output Node
The Neon Output Node depends on serverless postgresql backend to ensure your data tooling thrives with cool features. Like unblocking postgresql's upsert - built in an easy user experience. This Node syncs with your Data Lake, enabling users to gain data from any data...
Login to ET1.1 with Auth2
We are excited to announce the GitHub OAuth Login page is now active in ET1.1 (Neon). Picture a world where your most sensitive data files and database tables are protected with the same robust security protocols and layers you'd expect from a leading, Fortune 500...
ET1.1 Neon Input Node
The Neon Input Node is our first managed database access node, and an intuitive approach to giving people access to a serverless PostgreSQL which users are able to manage in Neon Lake. Data here is safe, and protected by 0Auth (Two way authentication). As you use...


