Articles.
In 2016, DEV3LOPCOM, LLC began sharing informative articles and technical tutorials about software, methodologies, research and programming languages.
Recent Articles
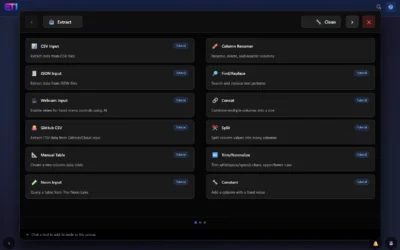
ET1.1 Training Menu Update
We have overhauled our original menu in ET1.1 to improve the adoption of the software and ease of usage. We've completely redesigned the node menu to now be a source of knowledge. The Training Menu in ET1 makes learning about data transformation tools faster, attaches...
ET1.1 Change Log | Version #1
Never have I ever tried to reverse engineer figjam! However once I was done, I realized there's a lot more within my grasp. Hey everyone, ET1.1 has come a long way, we have a free ETL version of ET1 that's available online, plus ET1 code on github (very trendy) and...
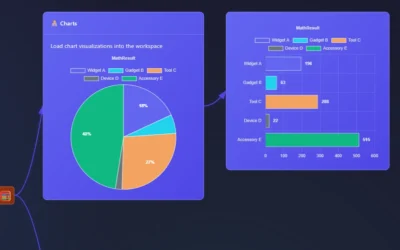
ET1.1 Charts Node
In ET1.1 Neon you can now pipeline your data to Charts. Pie Chart Donut Chart Polar Chart Bar Chart This covers an array of classic data visualizations and the same highlighting functionally flows through from data grid to charts. Making it the first ETL software that...
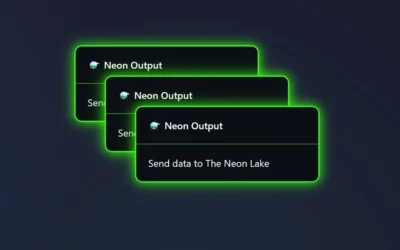
ET1.1 Neon Output Node
The Neon Output Node depends on serverless postgresql backend to ensure your data tooling thrives with cool features. Like unblocking postgresql's upsert - built in an easy user experience. This Node syncs with your Data Lake, enabling users to gain data from any data...

Login to ET1.1 with Auth2
We are excited to announce the GitHub OAuth Login page is now active in ET1.1 (Neon). Picture a world where your most sensitive data files and database tables are protected with the same robust security protocols and layers you'd expect from a leading, Fortune 500...
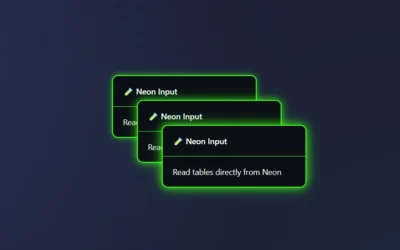
ET1.1 Neon Input Node
The Neon Input Node is our first managed database access node, and an intuitive approach to giving people access to a serverless PostgreSQL which users are able to manage in Neon Lake. Data here is safe, and protected by 0Auth (Two way authentication). As you use...
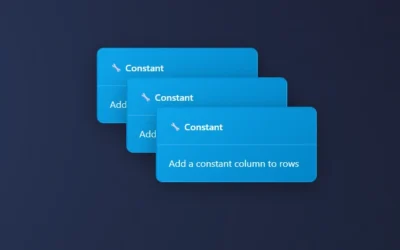
ET1 Constant Node
The Constant Node creates a constant value per row in your data pipeline. This node is extremely handy when transforming data in your ETL processes. The Constant Node is rather straight forward, two inputs and you're done. Using the Constant Node Add the Constant Node...

ET1 Concat Node
Bring your columns together as one with the Concat Node in ET1. This node is similar to concat() in Excel and allows you to easily bring more than 1 column together in your data pipeline, and also it gives you the ability to add the delimiter. The opposite of the...
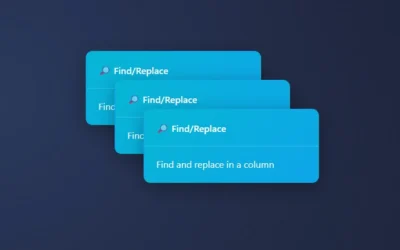
ET1 Find/Replace Node
Automatically finding and replacing data is possible using the Find/Replace Node! Find and replace works inside of sentences, words, numbers, and anywhere in the data. Similar to "find all" and "replace all," in your common Word Document software, ET1 offers the same...
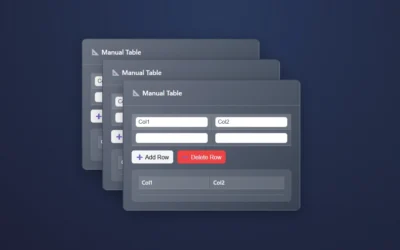
ET1 Manual Table Node
Create a table manually using the Manual Table Node. Manual Table node falls under the data input node category. Built to help you create small tables that you need to use in your data pipelines. When you need a thin layer of data, this is a great tool for manually...
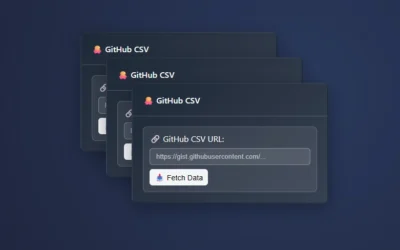
ET1 Github CSV Node
ET1's Github CSV Node is designed to help end users extract data from Github CSV URLs which are in public repositories. A public repository on Github is not a place to put your private or company information. However City/State for USA is a commonly used resource in...

ET1 CSV Input Node
The CSV Input Node, what a classic, flat files living on your computer can be consumed and the data can be extracted here in ET1. CSV is a common file type for data gurus. Comma-Separated Values, a plain text file format for storing tabular data with values separated...

ET1 JSON Input Node
When extracting data from a JSON file, try the JSON Input Node. JSON (JavaScript Object Notation) is a common data source. With ET1's JSON Input Node you can quickly open your JSON files and begin to transform the data, merge it with other data like offline CSV Node...
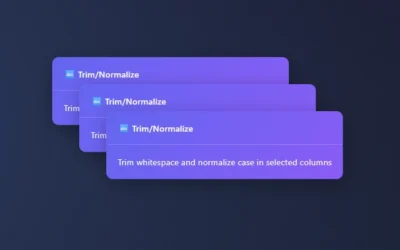
ET1 Trim/Normalize Node
Trim/Normalize Node is built to help you quickly clean your data pipelines and like the Column Renamer, built to make data pipeline maintaining simple, not complicated, and more than anything, easy to repeat. AT TIMES WE NEED CAPITAL LETTERS! Perhaps...
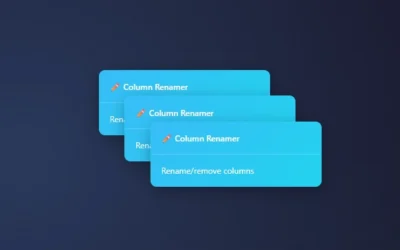
ET1 Column Renamer Node
Renaming columns in ET1 is straightforward and intuitive. You can also move the position of your columns by bumping the column left or right. Last, but not least, the ability to remove the column from the table. Column Renamer in ET1 is the place to manage your...
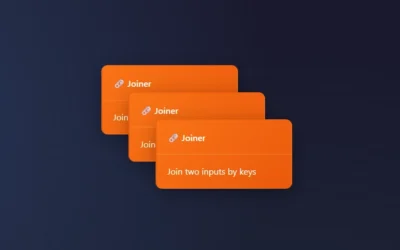
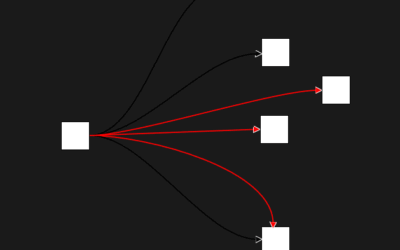
ET1 Joiner Node
On your magic quest to join data? We call it the Joiner node. A simple joining solution that helps people join data at a row level. In ET1, Joiner is focused on "keeping it simple" and will aim to automatically infers your joins. ET1 assumes. Inferring a join means it...
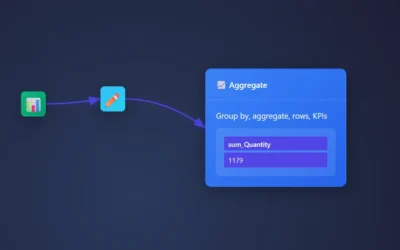
Create a KPI with ET1
Need a KPI? Aggregating the entire column into 1 value? ET1 has this capability built into the aggregation node. By using the Aggregation Node in ET1, and skipping the Group By column in ET1, you can immediately jump into creating column level KPI values. To create a...
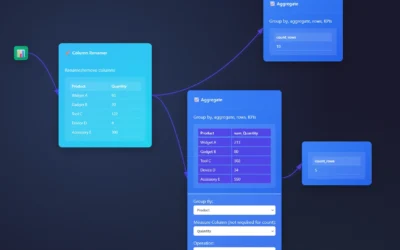
ET1 Group By Overview
Eager to group data? The Group By feature can be found in the Aggregation Node. Add the aggregation node to the canvas and send data downstream to this node. We have many products, however duplicate quantities across many suppliers, and we need to check the quantity...
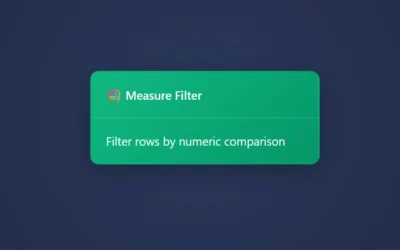
ET1 Measure Filter Node
When you have numbers, you have a need for a Measure Filter Node. Numbers are here, lets talk about it. Filtering with a number or decimal is straight forward using ET1. Using Measure Filter Node in ET1 Get started using the Measure Filter node. Attach data pipeline /...
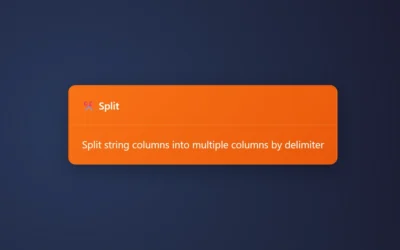
ET1 Split Node
The Split node lets ET1 user split one or more column into multiple columns. This particular node is great for the times you have multiple rows of data with consistent delimiters. The data we are splitting Here is the CSV you need to follow the overview. We will pass...