

Our Tableau Consulting Experience at ExxonMobil
On-site at ExxonMobil in Houston, our founder Tyler Garrett delivered the complete analytics stack: data engineering, ETL pipelines built in Alteryx, data warehouse design, and the Tableau dashboards on top of it all — from raw source systems through warehousing and transformation to executive-ready visualization, inside one of the largest enterprises in the world. No other boutique Tableau consultancy pairs former Tableau Software field experience with on-site Fortune-scale data engineering.

Tableau Server cluster migration
When GoPro needed to move Tableau Server from a single node to a high-availability cluster, Tyler Garrett was on-site to do the work hands-on: custom PowerShell automation, front-end customization of the Server interface with HTML, CSS, and JavaScript, and a full single-node-to-cluster migration — completed, upgraded, and optimized in a single day. GoPro's team: "We finished with our requirements three times faster than our team expected."
Read the GoPro case study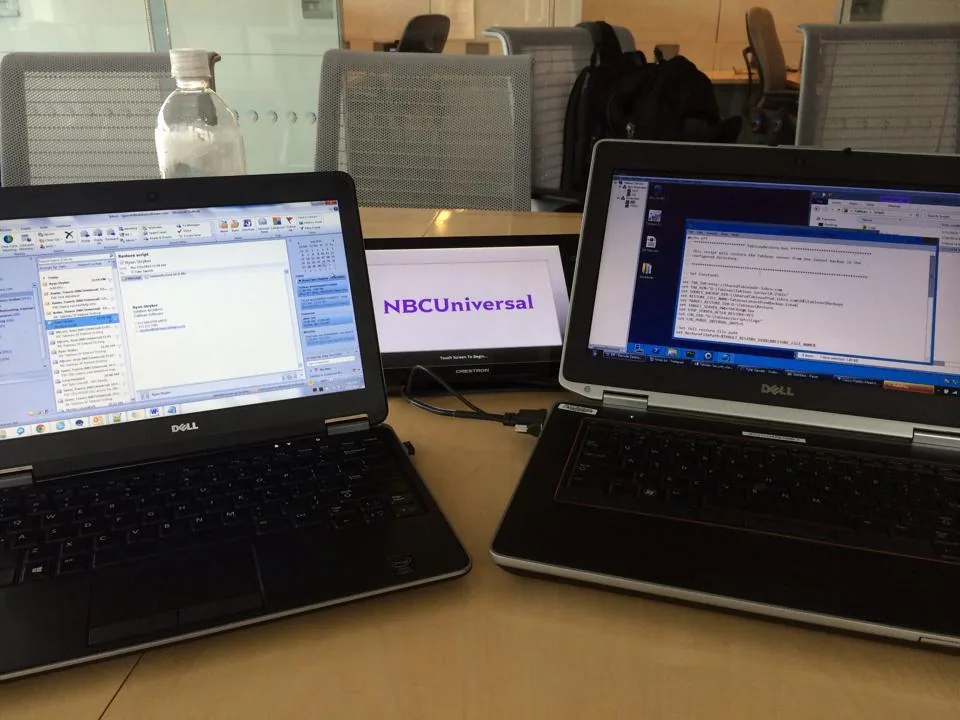
Enterprise Tableau at media scale
On-site at NBC, we saw firsthand how a major media enterprise runs Tableau at scale — the governance, the server administration, and the reporting cadence that keep analytics trustworthy for thousands of users. That perspective is exactly what we bring to help any team master the art of Tableau.
Our Tableau consulting services.
Hover any tile to learn more about how we can help.
Dashboard Development
Design · Build · Deploy
HoverDashboard Development
Interactive Tableau dashboards designed for clarity and impact. From executive KPI views to operational monitoring, we build visualizations that drive decisions.
Staff Augmentation
Full-time · Part-time
HoverStaff Augmentation
Experienced Tableau consultants embedded with your team. We handle analytics, SQL, and database work so you can focus on strategy.
Performance Optimization
Speed · Efficiency
HoverPerformance Optimization
Dashboards that load in milliseconds, not minutes. We optimize extracts, tune queries, and architect solutions that scale with your data.
Server Administration
Online · Server · Cloud
HoverServer Administration
Tableau Server and Tableau Cloud deployments, upgrades, and maintenance. Row-level security, permissions, and governance frameworks.
Data Source Management
Live · Extracts
HoverData Source Management
Efficient data sources that balance performance with flexibility. From live connections to optimized extracts, we ensure your data foundation is solid.
Training Programs
Workshops · On-site
HoverTraining Programs
Hands-on Tableau and SQL training to maximize your BI investment. We teach best practices, effective visualization, and self-service analytics.
Embedded Analytics
APIs · Integration
HoverEmbedded Analytics
Tableau embedded in your products. We handle authentication, theming, and the full integration lifecycle via JavaScript and REST APIs.
A Recommendation From Inside Tableau Software
I had the pleasure of working alongside Tyler at Tableau Software. Tyler and I worked together on several internal projects as well customer engagements. Through the time that we spent together, I witnessed his impressive technical, analytical, leadership, and communication skills.
Tyler possesses a passion for not just meeting both internal and external customer needs, but delighting them with holistic solutions that far exceed expectations. Whether it’s assisting a colleague or engaging a customer, he goes above and beyond to ensure the success of everyone with whom he interacts. When answering questions, his answers are thorough and precise.
Tyler is a person of integrity and solid moral character. While I continue to enjoy the dividends of his contributions at Tableau, I am very optimistic about his future endeavors.
— Mario Casillas, Senior Solution Architect at Tableau Software · July 2016
Transform Your Data with Tableau
Tableau is the industry-leading data visualization platform, and we’re experts at unlocking its full potential — from a single executive KPI view to a governed, self-service analytics platform serving thousands of users. Dev3lop was founded by Tableau Professional Services alumni, and our enterprise clients include Deloitte, Nielsen, GoPro, Boston Scientific, ExxonMobil, Kroger, PepsiCo, and WellCare.
How to Think About Your Tableau Solution: Users and Environments
Before a single dashboard gets built, the two questions that decide whether a Tableau rollout succeeds are who are your users and how does work move from development to production. Below are two of the planning frameworks we use with clients to frame those decisions — hover either card to see how we think about it.
A starting point for thinking about your own Tableau solution — the same diagrams we walk clients through in discovery.
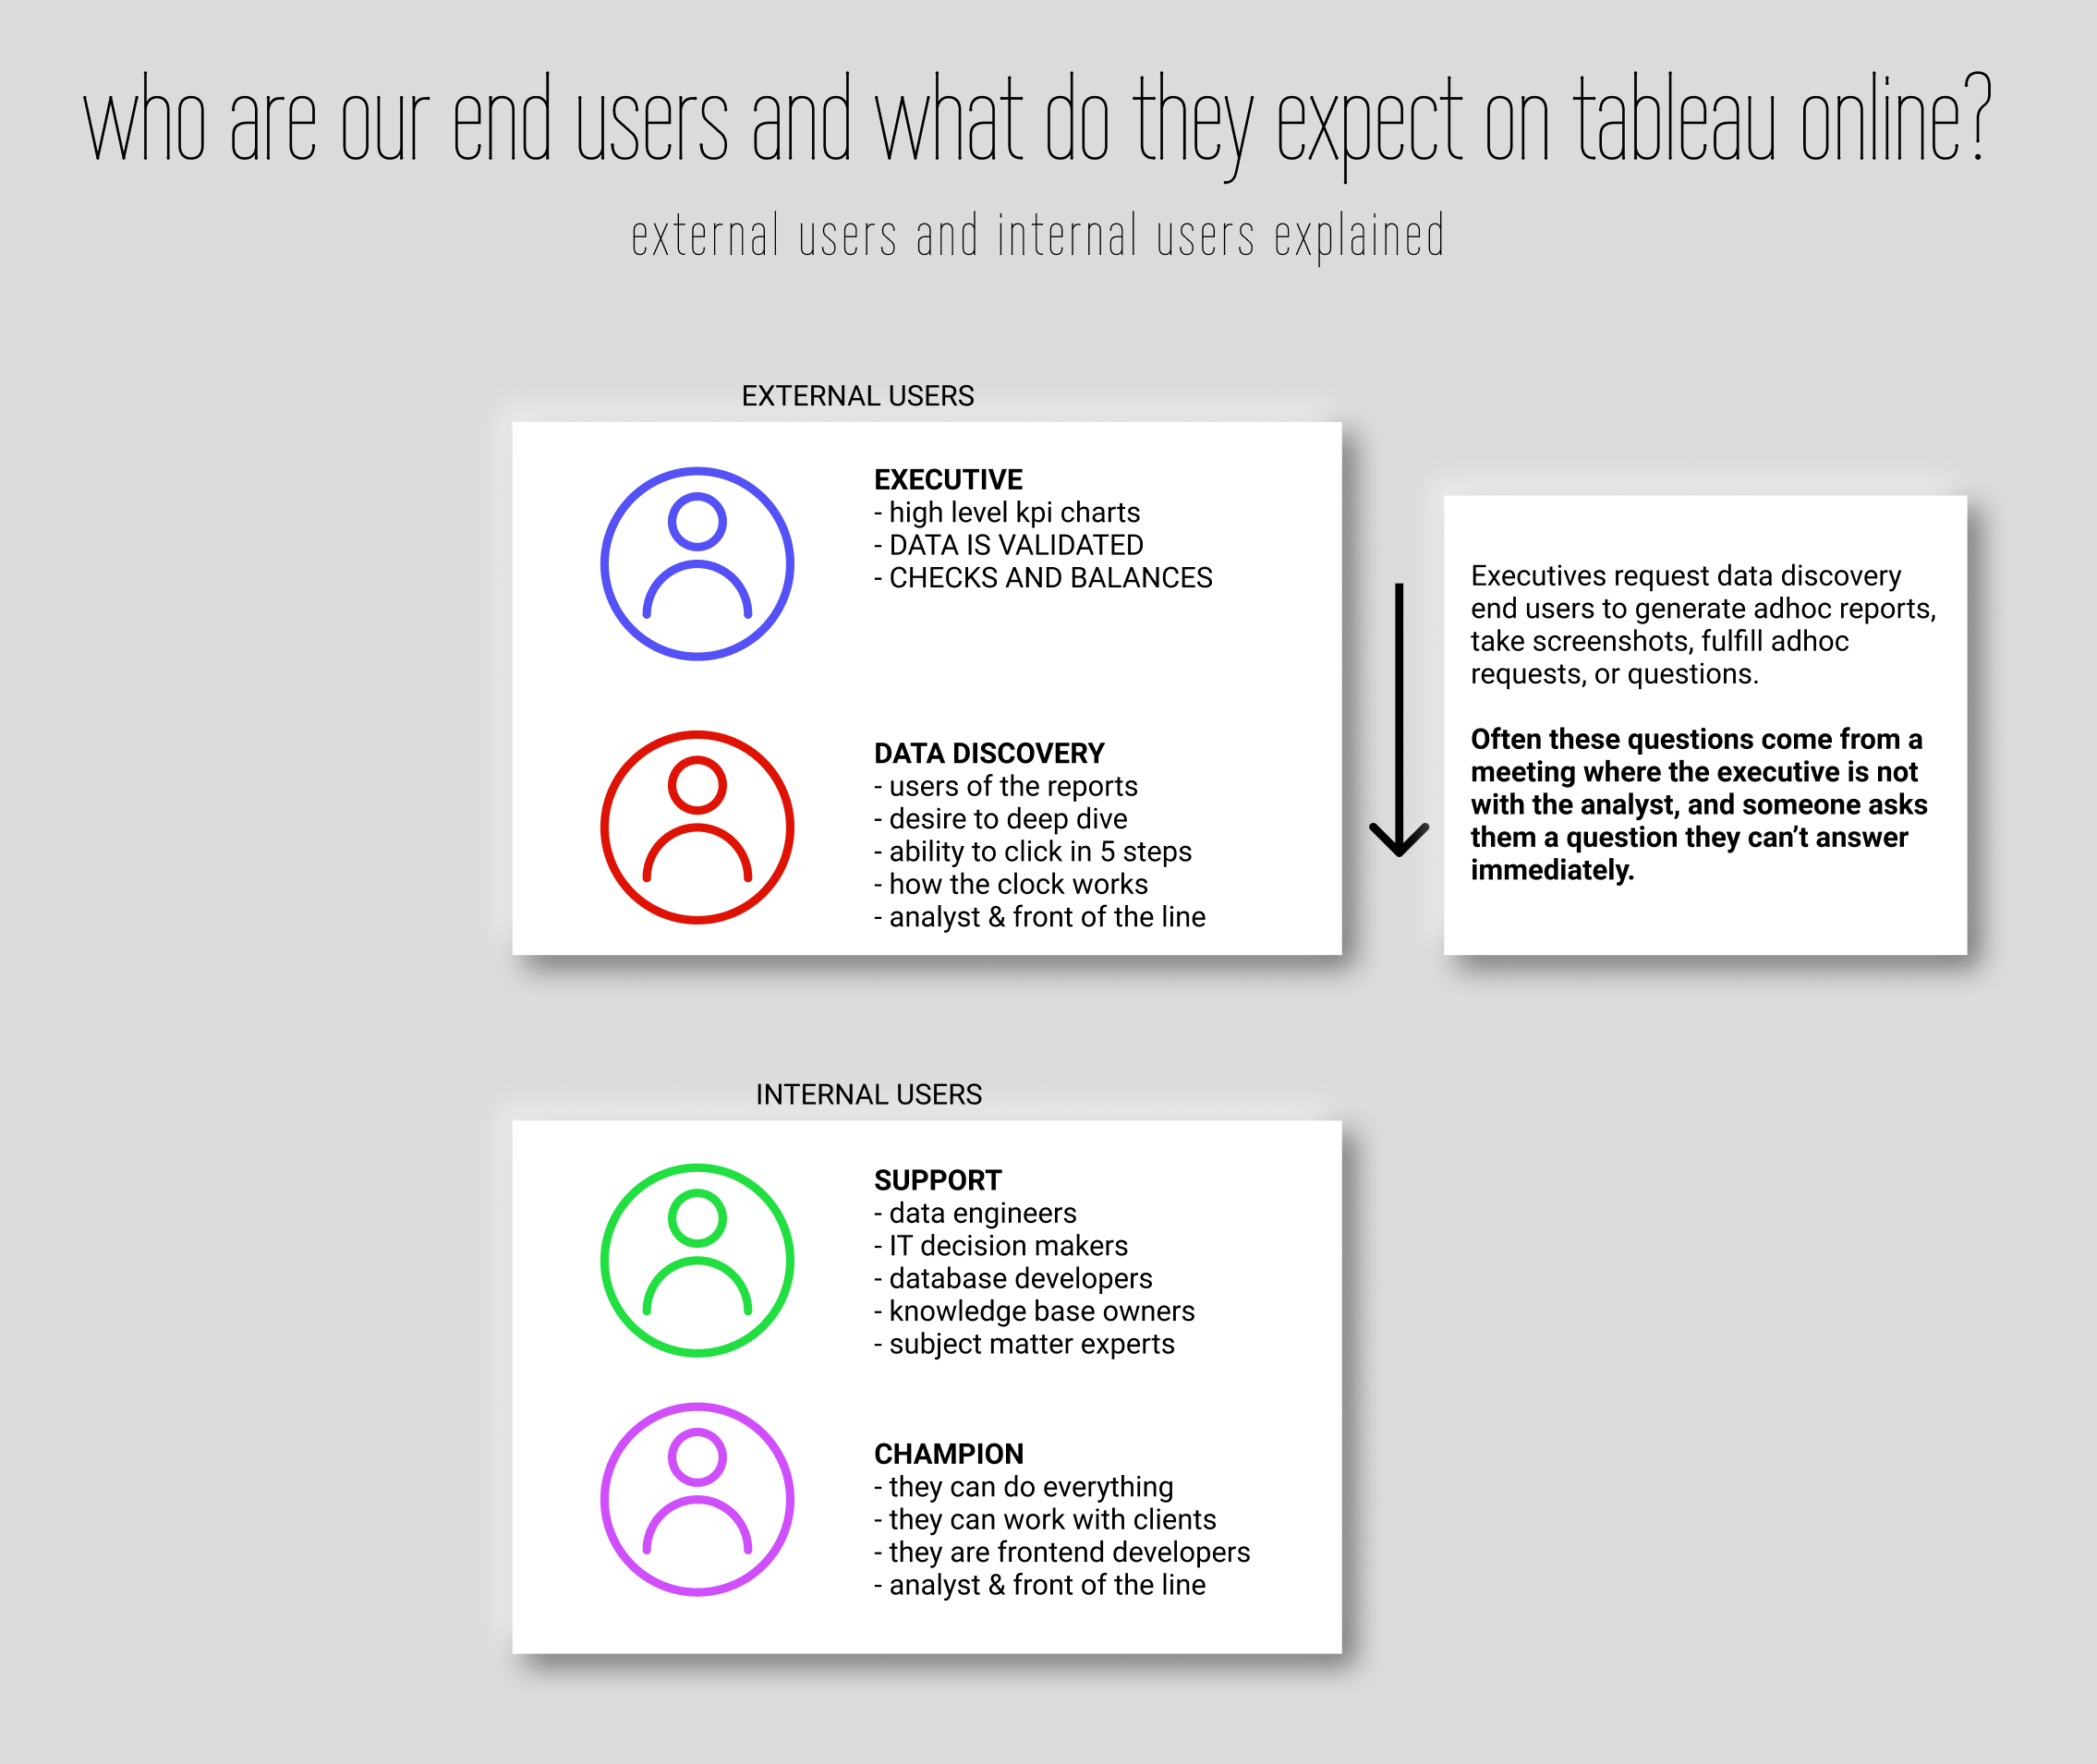
Know your Tableau users
Not every user needs the same thing. Executives want validated, high-level KPI charts. Data-discovery users want to deep-dive, click through in a few steps, and understand how the numbers were built. Internally, support engineers and subject-matter experts keep the data trustworthy, while champions can do everything and sit at the front of the line. Designing for the right persona is the difference between a dashboard people use and one they ignore.
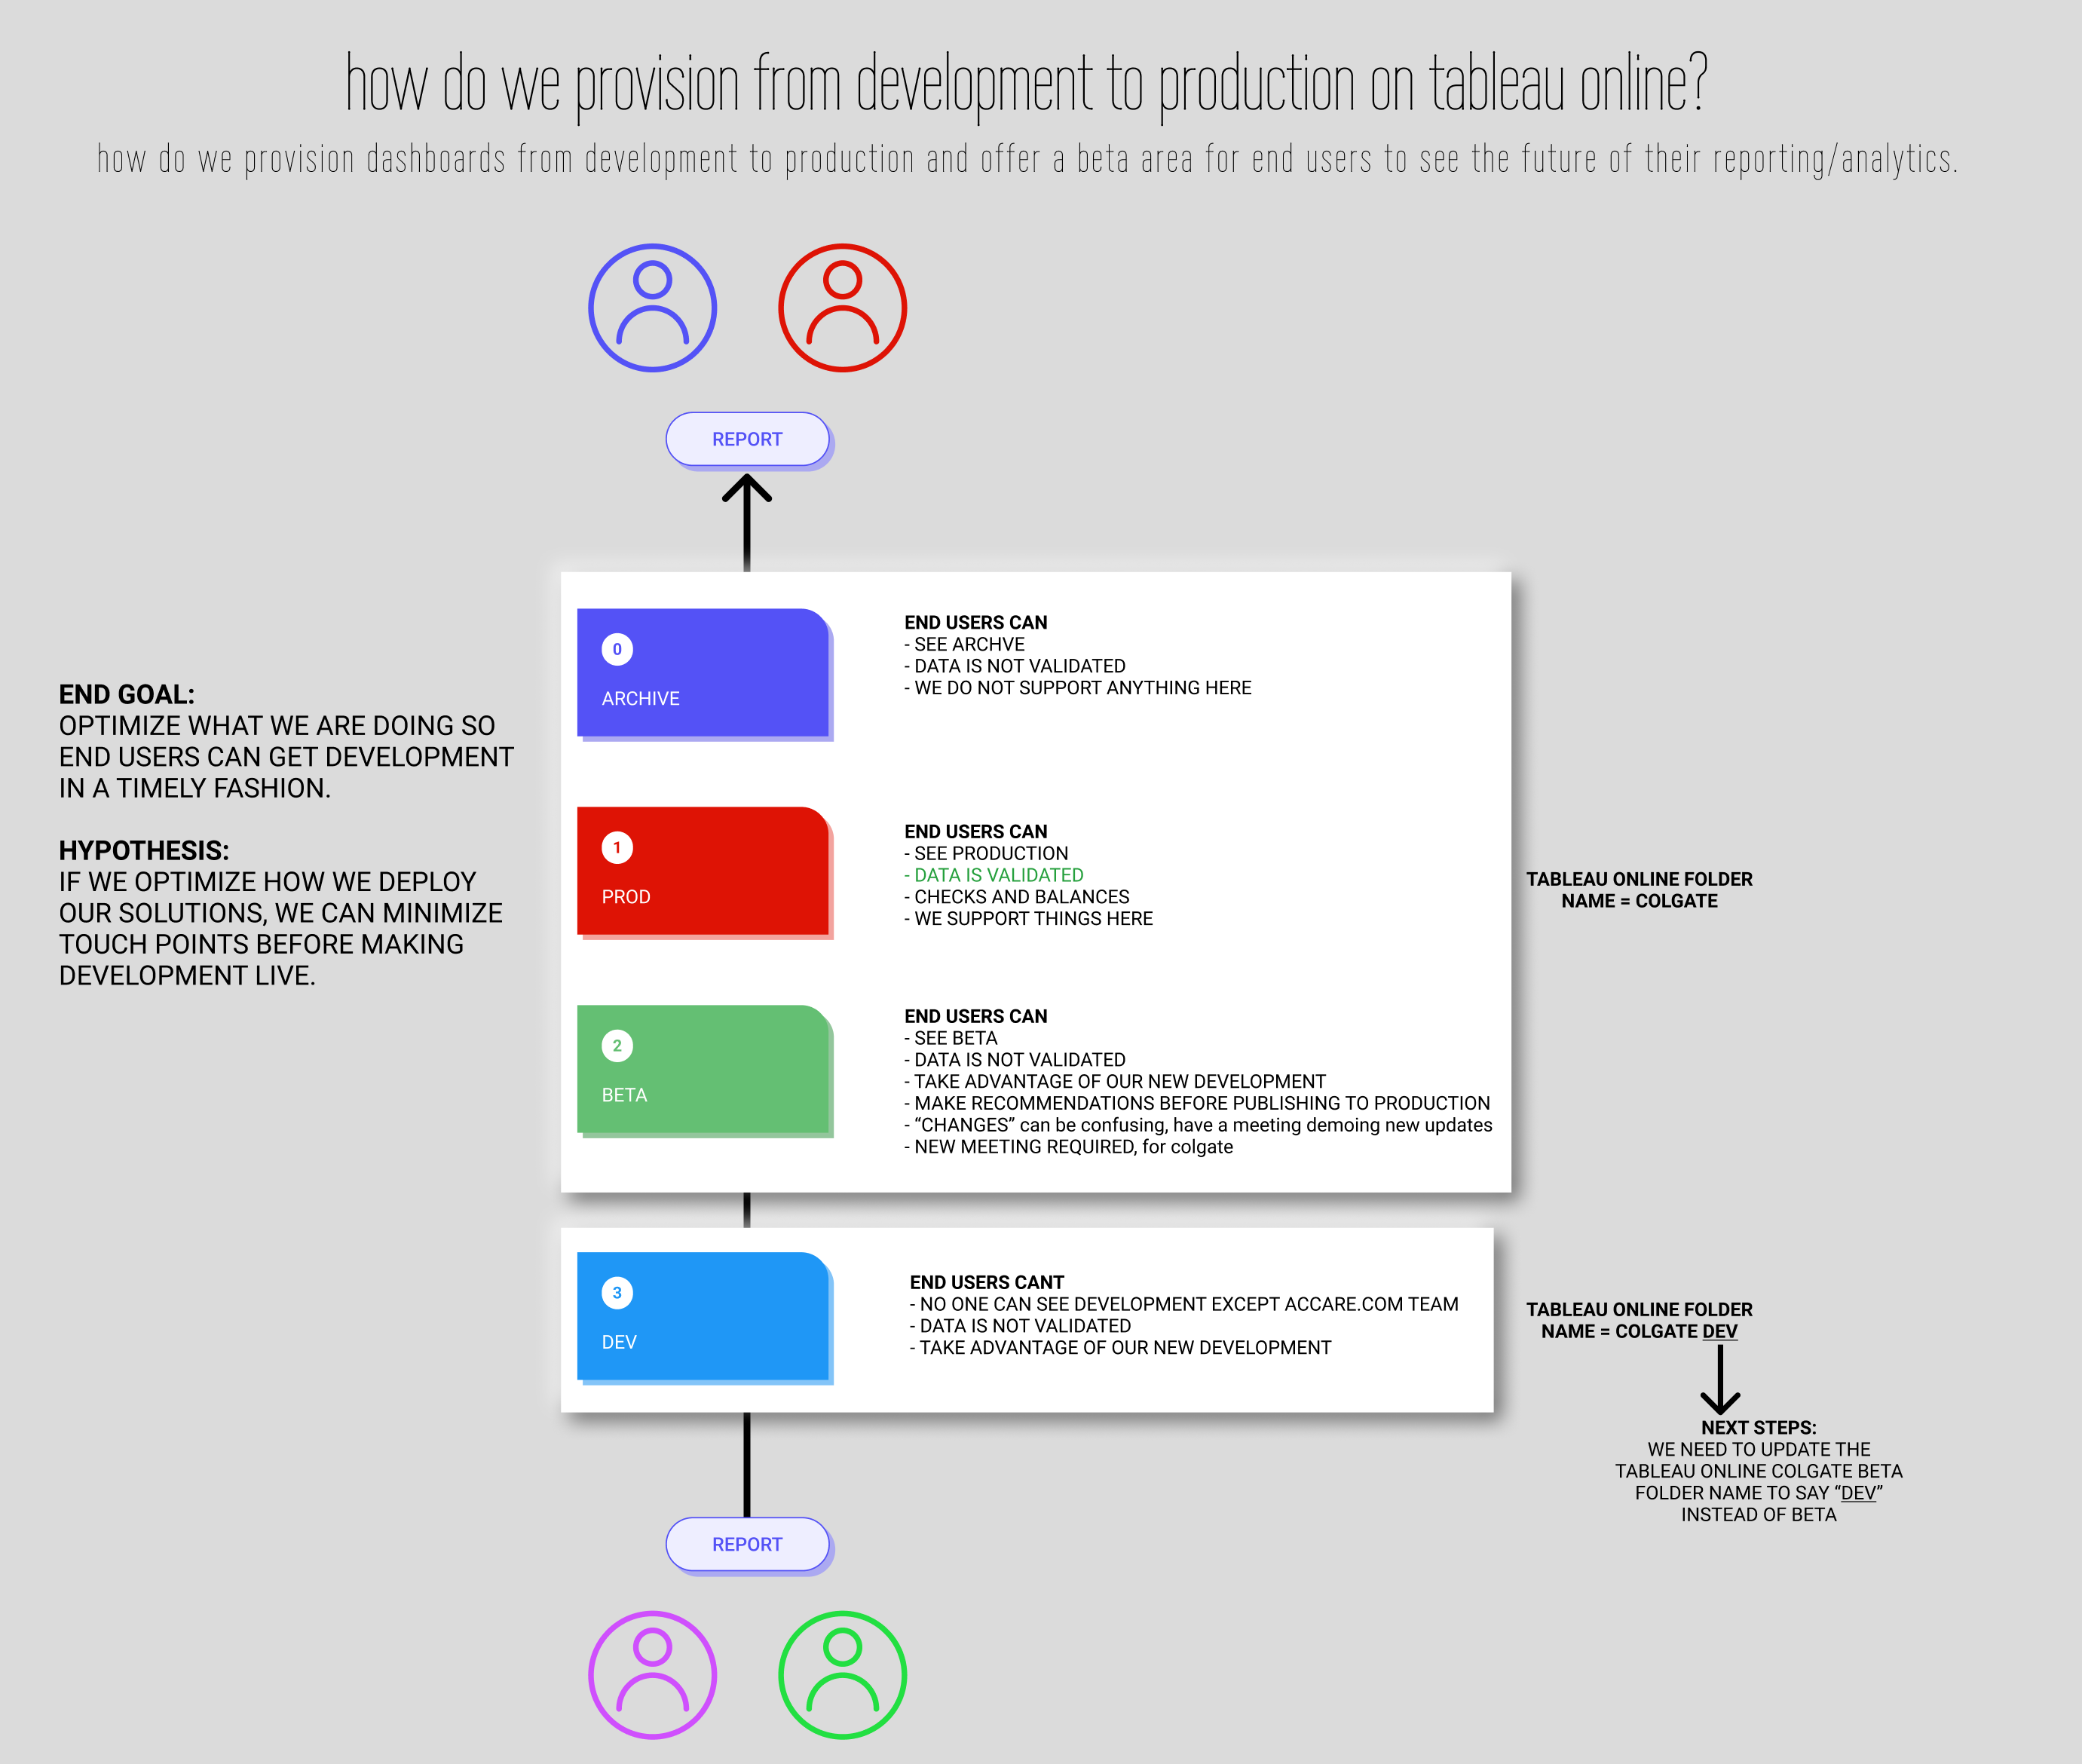
Provision deliberately
A mature Tableau environment separates Archive, Production, Beta, and Development so end users always know which data is validated and supported, and so new work can be previewed before it goes live. Getting this provisioning model right minimizes touch points and gets new development into users' hands faster.
Tableau Consulting, Explained
The details behind how we work — expand any topic.
Why choose Dev3lop for Tableau consulting?
- Certified Expertise: Our team includes Tableau Desktop and Server certified consultants
- Tableau Alumni: Founded by former Tableau Professional Services employees
- Austin-Based: Local support with on-site options across Austin and Dallas–Fort Worth
- Full-Stack Approach: We understand the entire data pipeline, not just visualization — see our data engineering consulting practice
- Platform-Agnostic Advice: We also consult on Power BI, so our Tableau recommendations are earned, not assumed
- Proven Track Record: Hundreds of successful Tableau implementations
How our Tableau consulting engagements work
Every engagement starts with a free discovery call. From there, most projects follow four steps:
- Scope — we review your data sources, existing workbooks, licensing, and goals, then propose a fixed scope or hourly plan. No surprises; you approve the plan before work begins.
- Build — dashboards, data sources, and server infrastructure are developed in short review cycles, so you see working Tableau assets weekly rather than waiting for a big reveal.
- Harden — we tune performance (fast calculations, extract strategy, filter design), set up permissions and row-level security, and document everything.
- Transfer — hands-on training and knowledge transfer so your team can maintain and extend the work without us. Consultants who create dependency are doing it wrong.
Engagement models include fixed-scope projects, hourly consulting, retainers, and full staff augmentation. Many clients start small — one dashboard, one workshop — and expand from there.
Tableau Server, Cloud, and administration
Dashboards are only half the platform. We deploy and administer Tableau Server and Tableau Cloud: installations, upgrades and restores, Server-to-Cloud migrations, single sign-on and SAML, permissions models, and governance frameworks that keep self-service analytics from becoming self-service chaos. Our Colibri dashboards even give administrators meta-visibility into how their Tableau Server is being used.
The only Tableau-bred consultancy that keeps the work onshore
Here is what sets Dev3lop apart from every “Tableau Gold Partner” in the directory: our founder Tyler Garrett came from Tableau Software’s own consulting organization and then built an independent Tableau consultancy — and kept the delivery 100% onshore.
Most large Tableau partners win the contract, then third-party and offshore the actual delivery to keep the lion’s share of the budget, while the consultants doing the real work earn the least. We flipped that model. At Dev3lop the work stays in the United States, the consultant on your project is the consultant Tableau trained, and our consultants earn more than they would at any traditional Tableau consultancy. You get senior, onshore, Tableau-bred talent — not a sales layer in front of an offshore back office.
On-demand Tableau services
Get access to experienced Tableau consultants quickly and easily. Whether you need help with a specific project, ongoing support, or comprehensive staff augmentation, we have the skills and availability to meet your needs.
- Gap analysis to identify optimization opportunities
- Project management for complex BI initiatives
- Custom end-to-end solutions from data modeling to deployment
- Knowledge transfer so your team can maintain and extend the work
Tableau resources from our blog
Not ready to talk yet? Our team writes extensively about Tableau:
- Tableau pricing, explained — licenses, tiers, and how to right-size your spend
- Is Tableau free? — what’s free, what isn’t, and what it costs
- Tableau vs Power BI: key differences — an honest comparison from a shop that consults on both
- Creating interactive dashboards in Tableau — our approach to dashboards people actually use
- How to write fast calculations in Tableau Desktop — the performance guide
Get Started
Ready to transform your data visualization capabilities? Let’s discuss how our Tableau consulting services can help your organization. Contact us for a free discovery call — we’ll tell you honestly whether you need a consultant at all.