In today’s dynamic digital landscape, businesses depend heavily on microservices to achieve scalability, agility, and rapid innovation. As organizations scale their applications, Application Programming Interfaces (APIs) emerge as essential connectors enabling seamless communication across different microservice components. However, a robust strategy for API performance monitoring and visualization isn’t just beneficial—it’s indispensable. Without meaningful visualization and monitoring tools in place, technical leaders and decision-makers risk flying blind into operational turbulence. At Dev3lop, we guide our clients through the maze, harnessing advanced data analytics, thoughtful innovation, and strategic consulting to translate raw API performance data into clear, actionable visual insights. Let’s explore powerful strategies to effectively monitor microservices APIs and harness the full potential of visualization tools in optimizing your organization’s software infrastructure.
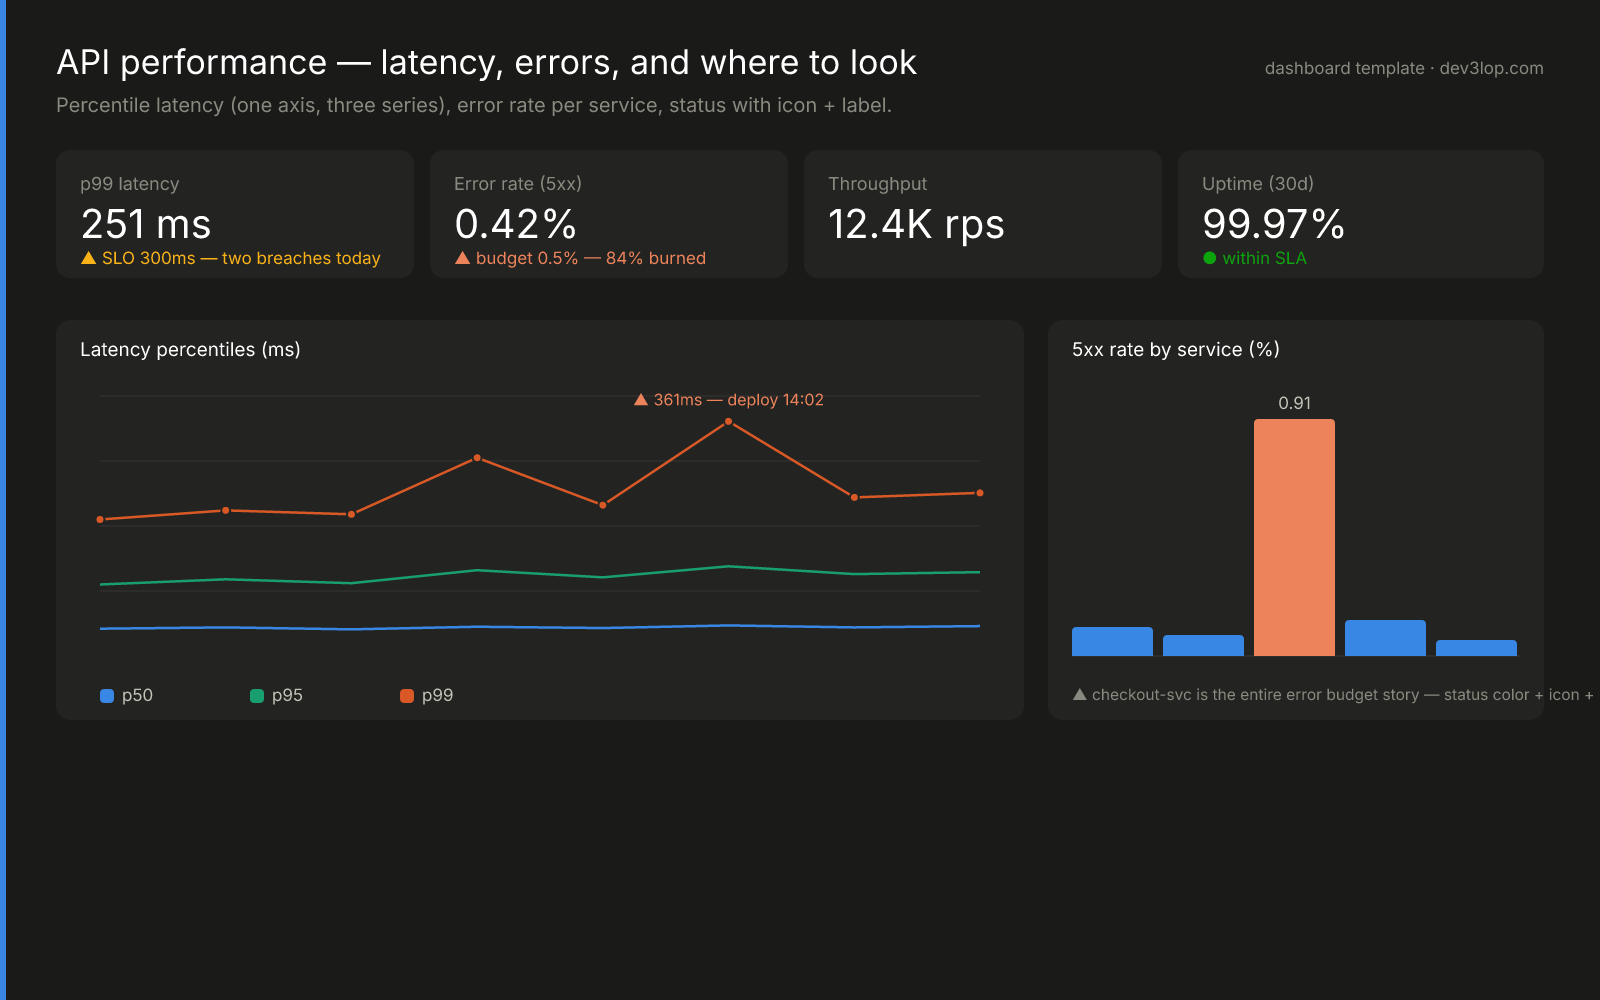
The template: latency, errors, and where to look
The layout first, arguments after. Latency lives on one axis as three percentile series — p50, p95, p99 — because a dual-axis chart is how monitoring dashboards lie to you; the annotated spike ties the worst p99 to the deploy that caused it. In the service breakdown, four services wear ordinary categorical colors and one wears the reserved serious status color with an icon and a label — status hues never moonlight as “series 4,” and nothing signals by color alone. Tiles state the SLO next to the number, because a latency figure without its budget is trivia. The strategies below are what keep a page like this truthful under incident pressure.
Your starting places, chart by chart
Before the observability platform conversation: both of these can be built from data you already have in your APM’s export API. Start with one.
Percentiles on one axis
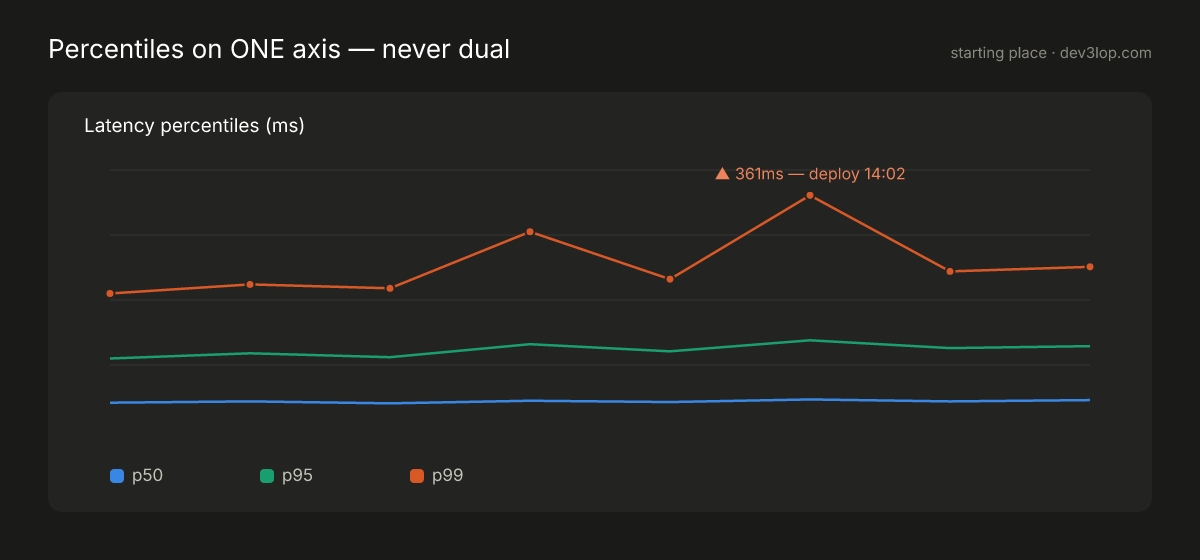
What it answers: what latency feels like for the median user, the unlucky user, and the user who’s about to file a ticket — on one honest scale. Data you need: timestamp plus p50/p95/p99 — every APM exports these. Make it yours: the annotation is the empowering part — tie the spike to the deploy, the config change, the incident. A chart that names its causes replaces the first fifteen minutes of every incident review. And when a series dwarfs the others, resist the second axis; a log scale or a separate chart keeps it honest.
The exception wears the status color
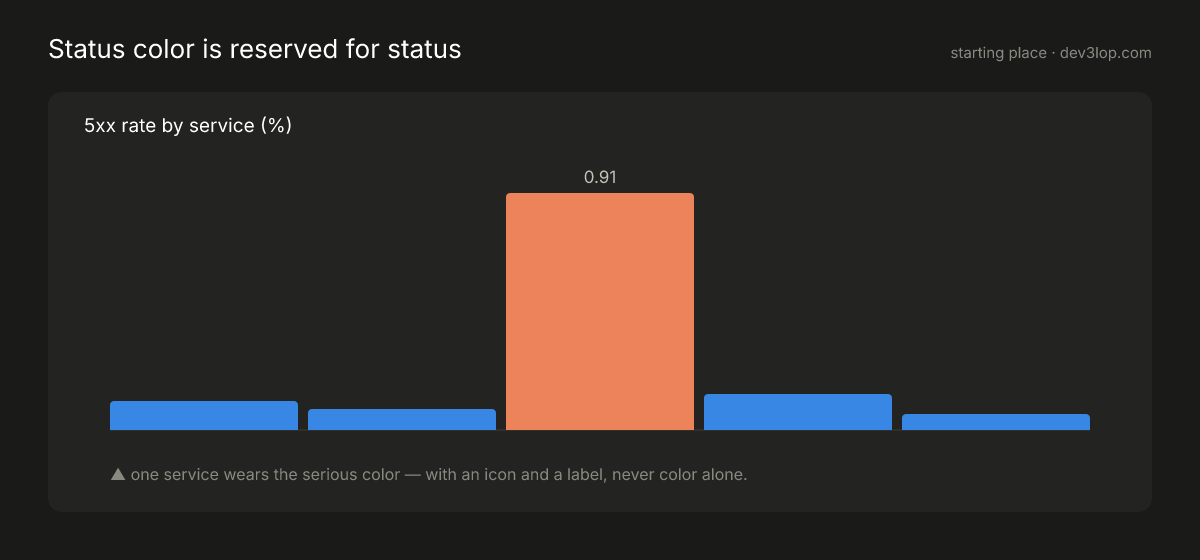
What it answers: which service is spending the error budget — without making every bar shout. Data you need: service and error rate, plus the threshold that defines “in trouble.” Make it yours: the rule to keep is the reservation: status colors (good/warning/serious/critical) never moonlight as ordinary series colors, and they never appear without an icon and a word. Apply that one rule to your existing dashboards and watch how much quieter — and clearer — they get.
Understanding the Importance of API Performance Monitoring in Microservices
Microservices architecture allows businesses flexibility, agility, and faster deployment cycles by breaking down complex applications into smaller, independent services. However, these benefits come at a cost—complexity in monitoring interactions among multiple APIs. APIs drive critical interactions between individual microservices—ensuring these components communicate efficiently—and therefore API performance directly affects overall system health and user experience. A single failing or suboptimal API can quickly propagate problems throughout your distributed environment. Proactively monitoring API performance metrics—such as response time, error rates, throughput, and availability—is essential to detect and resolve bottlenecks early. Robust monitoring informs decisions on scaling, load balancing, and optimizing resources. For decision-makers responsible for aligning technical strategies within evolving infrastructures, transparent and efficient API performance monitoring helps mitigate risks and enhances trust across software development and operations teams. Leveraging performance visualization combined with expert Azure consulting services significantly boosts understanding and management of these complex microservices ecosystems. Visual dashboards translate data into valuable insights, empowering engineers and executives alike to quickly diagnose issues and make data-driven improvements promptly and confidently.
Critical Metrics for Effective API Monitoring
To measure API efficacy, it’s crucial to identify and track meaningful metrics specific to your organization’s microservices environment. Focusing solely on response time doesn’t fully capture API health—leaders should instead adopt a composite suite of metrics for balanced insight:
Latency and Response Times
API latency—the time it takes for an API call to respond—is a fundamental indicator of user experience. High latency decreases customer satisfaction and signals potential performance bottlenecks. Key metrics include average response times, percentiles, and maximum latency spikes.
Error Rates and Failures
Tracking error rates—including HTTP response codes (such as 4xx and 5xx)—secures early detection of issues. High-level visualization dashboards highlighting error codes help teams rapidly locate problems and apply targeted solutions. Proactive analysis of error patterns also feeds directly into continuous improvement strategies.
Throughput and Request Volumes
Throughput—requests processed per second by your APIs—illustrates system capacity. Tracking throughput helps teams gauge the system’s baseline behavior and plan for scaling infrastructure during peak usage. Understanding regular traffic patterns assists with accurately forecasting future resource allocation needs. By clearly measuring these critical dimensions, teams gain the comprehensive view required for reliable decision-making. Accurate metrics combined with advanced visualization allow technical leadership to quickly pinpoint anomalies and contextually interpret performance issues, enabling proactive optimization.
Advanced Data Visualization Techniques for Root Cause Analysis
API performance data is powerful only when communicated effectively. Raw data tables and numbers alone cannot reliably surface meaningful patterns, trends, or anomalies. Technical leaders require intuitive visual dashboards to quickly interpret real-time API health. This is where advanced data visualization techniques become indispensable. Time-series visualizations offer visibility into performance patterns, helping teams discover trends, seasonality, and operational anomalies. Utilizing effective strategies such as Entropy-based Anomaly Detection provides innovative ways to proactively detect subtle patterns signaling potential disruptions. Interactive visualizations allow quick drill-down analyses, enabling specialists to uncover deeper root causes efficiently. Furthermore, tree maps, heatmaps, and geo-distributed visualizations enable rapid understanding of complex problems linked to geography, microservice interactions, or resource bottlenecks. These visual tools complement exploratory techniques such as recursive viewing patterns explored in our past article: Recursive Materialized Views for Hierarchical Analytics. Harnessing sophisticated visualization platforms—such as custom-built dashboards or analytics solutions integrated into cloud platforms—can significantly reduce the time to meaningful insights and accelerate issue resolution. Investing in these advanced visualization strategies transforms raw API performance data into actionable intelligence for broader strategic decision-making.
Implementing Continuous Improvement and Real-time Alerting Systems
Visibility without action is insufficient. Establishing a proactive monitoring strategy involves a continuous improvement mindset combined with real-time performance alerts triggered by key threshold breaches. By configuring automated monitoring and alerting, development and operations teams promptly receive actionable notifications regarding performance deviations—enabling faster recovery and downtime reduction. Incorporating real-time monitoring alerts into your CI/CD Pipeline delivers critical operational benefits seamlessly, ensuring faster delivery cycles without compromising performance quality. Leveraging automated alert tools integrated directly into existing operational workflows ensures adherence to pre-defined service-level agreements (SLAs) and reduces manual intervention. Strategic API performance visualization coupled with alerting capabilities provides comprehensive benefits, significantly impacting overall operational excellence. Continuous monitoring helps teams stay ahead of emerging issues and fosters proactive operational behaviors, solidifying a culture of continuous learning and agile improvement within organizations—as discussed in our careful approach to continuous improvement in predictive analytics: Continuous Learning for Demand Forecasting.
API Governance, Data Quality, and Deprecation Management
Effective monitoring strategies encompass more than merely tracking real-time API performance metrics. Forward-thinking leaders understand the critical importance of API governance—a robust framework that establishes clear data quality standards, lifecycle management, and communication of API health across the organization. API endpoints inevitably evolve, requiring thoughtful management and proactive deprecation plans. Organizations must implement structured processes ensuring API deprecation minimizes disruption to developers and end-users. Detailed insights into API consumption patterns assist organizations in making informed decisions around when and how APIs are deprecated, as discussed in our detailed breakdown: Implementing Data Asset Deprecation Workflows. Additionally, establishing strong data quality standards within your APIs proactively ensures trustworthiness and reliability—crucial factors forming the foundation of data-informed decision-making. Data quality monitoring allows companies to assess API health beyond basic uptime measures by applying clearly defined thresholds identifying potential data degradation or anomalies. Together, API governance, data quality management, and sophisticated performance monitoring visualization frameworks empower organizations to evolve microservice APIs without risk or ambiguity continuously. They form essential building blocks for maintaining resilient API-driven ecosystems—supports innovation, accelerates software velocity, and enables robust digital transformation journeys.
Building Expertise: Enhancing Your Microservice Infrastructure
Successfully managing APIs within complex microservices environments necessitates ongoing technical refinement and talent development. Many organizations find substantial value partnering with experienced technical strategists to enhance their data environments—clarifying complexities and navigating future challenges expertly. Understanding what it’s like hiring engineers specialized in data environments ultimately simplifies the journey toward adopting increasingly agile API performance monitoring and visualization frameworks. Such specialized expertise is essential for identifying constraints, designing powerful visualizations, and integrating scalable monitoring frameworks into your technology stack. Organizations choosing thoughtful strategic investment in specialized consulting services gain practical clarity around API performance metrics, optimize visualization features, and effectively implement governance structures. Ultimately, expert knowledge combined with data-driven strategies generates significant business value, reduces associated technology risk, and accelerates long-term capability development. Our team at Dev3lop specializes in supporting organizations through every step of data maturity, from initial monitoring strategies to refined performance visualizations, crafting powerful analytical experiences that drive innovation, scalability, and excellence in digital capabilities.
Thank you for your support, follow DEV3LOPCOM, LLC on LinkedIn and YouTube.