Articles.
In 2016, DEV3LOPCOM, LLC began sharing informative articles and technical tutorials about software, methodologies, research and programming languages.
Recent Articles
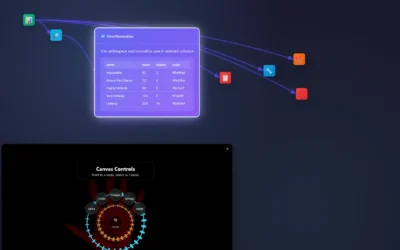
Using Your Hands in ET1
If a web-cam is available ET1's code will try to automatically sync and if you can wave and point, this radial menu is a fun way to augment your ETL development. Using computer vision (explained in depth below) we map a skeleton over your hands and able to create a...
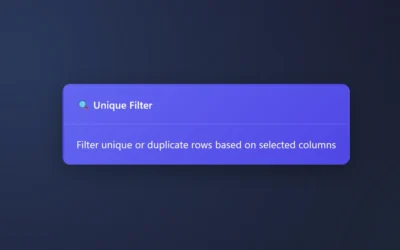
ET1 Unique Filter Node
The Unique Filter Node or Unique Tool finds unique values per row in your data pipelines, or allows people to quickly review duplicates only. Plus, you can select what column(s) to find unique values within. This enables people to easily understand what is inside of a...
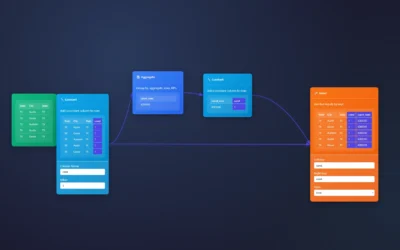
Append Fields with ET1’s Joiner
Seeking to append fields like the Alteryx Desktop software? The Joiner Node and Aggregate node is here to help. You will also need a constant to join on across both data streams. We will show you how in this example below where we are sent 6million records in a CSV...
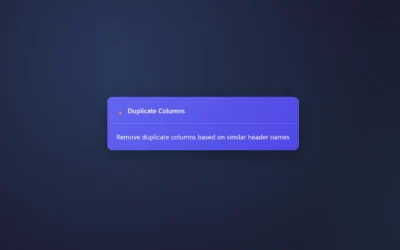
ET1 Duplicate Columns Node
Dealing with duplicate columns? This particular node is designed to remove similarly named column headers. If "State"="State" then we remove the last column and only keep the first column. "Remove duplicate columns based on similar header names" Currently there are no...
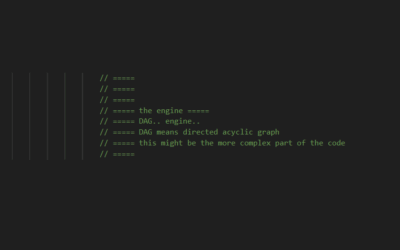
ET1’s DAG Streaming System
Familiar with graphs? How about DAGs? This is not a paradigm shift, but think of DAG as a cool way for tiny team in Austin/Dallas Texas to build an Extract Transform and Load software! Think of "DAG" like rules, which enable data processing unlike software like...
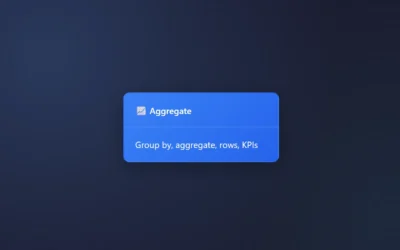
ET1 Aggregation Node Overview
Aggregation, what a classic. Aggregating your data is a landmark trait for any data steward, data wrangler, or data analyst. In ET1, you can easily aggregate your data. The Power of Grouping (Group By in ET1) with the Aggregate Node Aggregations turn a sea of numbers...
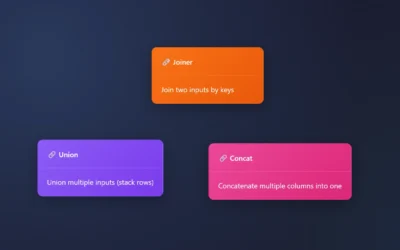
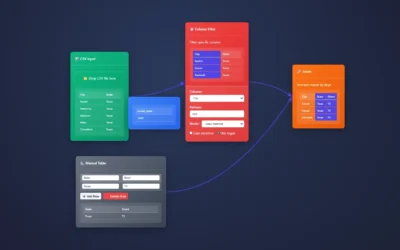
ET1 Data Combination Tools
Are you combining the data? We have you covered. ET1 has all the right tools. The Three Musketeers of Data Combination 1. 🤝 Join (The Matchmaker) What it does: Combines tables based on matching values Perfect for: Merging customer data with their orders Adding product...
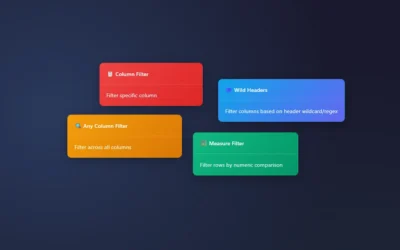
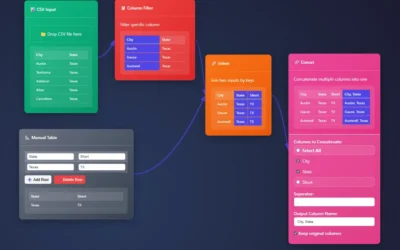
Filtering Nodes in ET1
The filtering nodes help you reduce the number of rows, drill into the exact information needed, and create a data set that will add value VS confuse your audience. When filtering, remember you're reducing the amount of data coming through the node, or you can swap to...
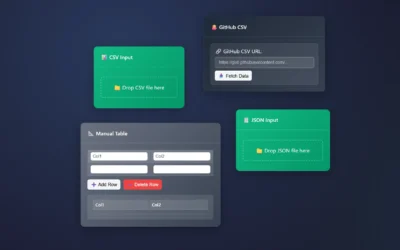
ET1’s Data Input Node Overview
CSV, JSON, and Public CSV endpoints or manual tables. These help you kick start your data pipeline. Once your data comes into the data input, it begins to flow downstream using a custom DAG streaming engine. Input Node Overview The Input nodes are essential for moving...
ET1 Basic Training
ET1 helps you extract, transform, and load data in a single user-friendly canvas. Data automation in a single canvas. Each node is simple and easy to use in VR/AR headsets. Welcome to basic training, where we show you the basics so that you're dangerous. Don't worry...
About ET1, A Tool to Help Uncomplicate Data
It is undeniable that data can be overwhelming, and those who work with it daily are adept at navigating this complexity. ET1 is designed to assist individuals in managing this chaos, eliminating the constraints associated with outdated software that is over 20 years...
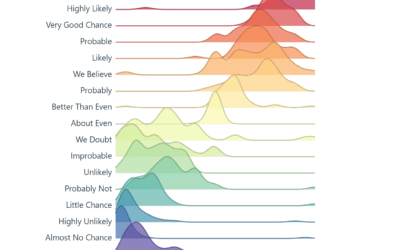
Evolving the Perceptions of Probability
What does the CIA’s “estimation probability” have to do with data visualization and a Reddit poll? Think of it like this: the CIA, and many government agencies, has teams who dig through research, write up reports, and pass them along to others who make the big calls....

Sessionization in Clickstream Event Processing
Imagine unlocking a granular understanding of your users—not just what pages they visit, but the organic, session-based journey each person takes across your digital landscape. At Dev3lop, we view sessionization as the strategic foundation to truly actionable...

Sub-Second Alerting Pipelines for Operational Signals
In today’s hyper-competitive, digitally transformed landscape, operational latency is the new technical debt—and every second (or millisecond) delayed in surfacing actionable signals impacts revenue, reliability, and user experience. At Dev3lop LLC, we architect and...

Event-Driven Microservices with Persistent Logs
Imagine a digital ecosystem where applications respond to business events instantly, where data is always consistent and traceable, and where scaling horizontally is the norm, not the exception. At Dev3lop LLC, we thrive at the intersection of agility, analytics, and...

Real-Time Feature Extraction for Online ML Scoring
In the era of relentless digital acceleration, decision-makers are under mounting pressure to leverage every data point—instantly. The competitive landscape demands more than just machine learning; it requires the ability to extract, transform, and act upon raw data...

Adaptive Autoscaling for Variable Event Rates
In the fast-evolving landscape of real-time data, managing unpredictable event rates is more than just a technical feat—it's a strategic advantage. At Dev3lop, we help companies leverage adaptive autoscaling to meet volatile demands, optimize costs, and drive...

Streaming Join Optimization Across Heterogeneous Sources
The era of high-velocity, multi-source data is redefining enterprise analytics and intelligence. As more organizations invest in robust data engineering and real-time insights, the challenge of executing performant streaming joins across heterogeneous sources has...

Sliding and Tumbling Window Metric Computation
In the fast-evolving landscape of data-driven decision-making, tracking time-based metrics reliably is both an art and a science. As seasoned consultants at Dev3lop, we recognize how organizations today—across industries—need to extract actionable insights from...

Hot Path vs Cold Path Real-Time Architecture Patterns
In today’s data-fueled world, the shelf life of information is shrinking rapidly. Decisions that once took weeks now happen in minutes—even seconds. That’s why distinguishing between “Hot Path” and “Cold Path” data architecture patterns is more than a technical...