{/* Content imported from WordPress - review and enhance */}
Today, we would like to highlight the functionality of Date Buckets, which is how we like to think of it mentally, and others call it Period-over-Period Analysis within Tableau Desktop. Both periods are buckets of dates and work great with min(1) kpi dashboards and often used in our Tableau Consulting engagements.
This blog delves into a method for date calculations to be used as trailing periods of time, to gain access to quick change between two periods in Tableau. In other words; We are focusing on identifying the last two periods in your data source, and the end user supplies a value to increase those buckets based on a date part you pick.
This approach enhances the efficiency and clarity of your analytical processes with Tableau and is easy to re-use. There are many ways to write this calculation and this is one way to write the calculation.
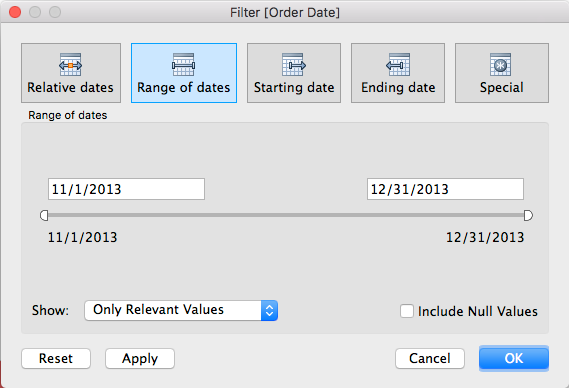 between dates filter
In Tableau this between date filter will create two calendar inputs, most executives don’t want to click anything.
It only takes 3 steps to build self generating, automated (not static set filters), date buckets in tableau desktop that trail with your max date in the date column .
 lol, type this stuff or paste the code coming from this tutorial.
Below please find my quick win tutorial as a means of quickly winning… on any Tableau workbook with a date and a parameter.
We will be using the SuperStore Subset of data.
Which comes with every license of Tableau Desktop. In your data, you probably have a date. Use that date and follow along with these next two steps.
To begin, you need a date, and a parameter.
Step 1, make a date variable named W.
Create a new calculated field in tableau desktop, call it W.
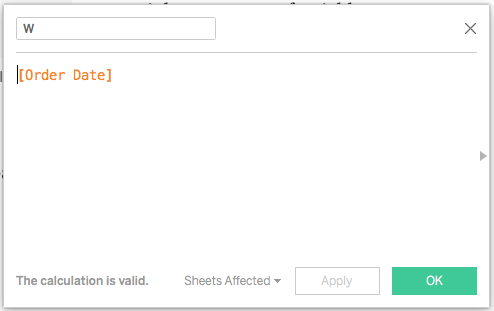 make a simple variable W in place of your date. your date goes in this calculated field.
Now make the parameter.
Step 2, make a parameter variable named X. It’s an integer.
This will be the number of ‘X’ per period of analysis.
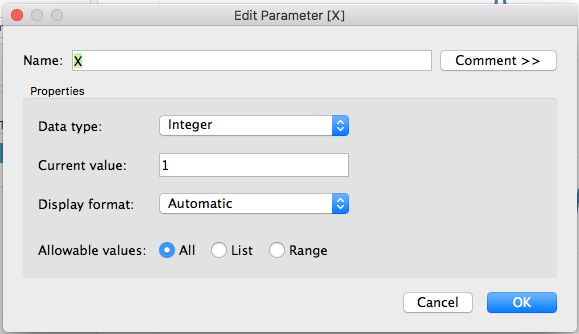 make a simple variable X in place of your parameter.
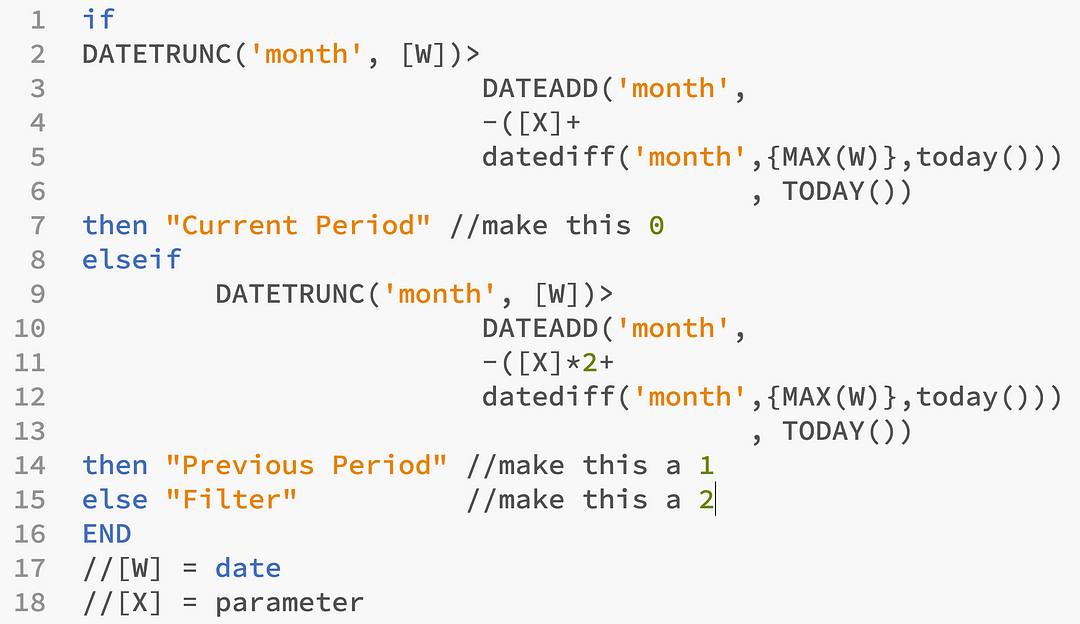
Paste the calculation below in any workbook with a Date and Parameter.
Above, if you followed along, you will not need to make any major changes to the calculation.
if DATETRUNC(‘month’, )> DATEADD(‘month’, -(+ datediff(‘month’,{MAX()},today())) , TODAY()) then “Current Period” //make this 0 elseif
DATETRUNC(‘month’, )> DATEADD(‘month’, -(*2+ datediff(‘month’,{MAX()},today())) , TODAY()) then “Previous Period” //make this a 1 else “Filter” //make this a 2 END // = date // = parameter
Drag drop this on to the view, right click filter, filter filter…
Now, only two buckets of time are available. You’re welcome!
Automated period over period analysis in Tableau
You’ve just implemented automated date buckets in Tableau, allowing end-users to control visualizations using the bucket generator. Personally, I find the tool most effective when using it in a daily context rather than a monthly one. However, the monthly option provides a convenient way to encapsulate dates within distinct periods, while the daily granularity offers a simpler and more immediate view.
Having a rapid date divider or bucket automation at your disposal is highly advantageous. It empowers you to visually highlight disparities between two date periods or employ the calculations for logical flagging, subtracting values, and determining differences, all without relying on the software to construct these operations through window calculations.
Optimization date buckets or period over period in Tableau
Optimization #1: remove LOD calculations
Nothing against LOD calcs, except they are slow and built to help users who don’t know SQL.
{max(W)} seeks to find the max date, you can find it easier using a subquery in your select statement. If you don’t know what that means, ask your data architect supporting your environment to add the max(date) as a column, and have it be repeated per row too. They will know what to do or you need a new data architect.
Optimization #2: stop using % difference or difference table calculations
Nothing against table calculations, except they are slow and built to help users who don’t know SQL.
Optimization #3: change strings to integers.
Nothing against strings, except they are slow.
It’s likely not your fault that you’re using strings in 2018 with if statements, it’s probably because someone taught you who also did not know how to write optimized Tableau calculations.
Optimization #4: ‘month’ date part… add a swapper.
The Datetrunc is used to round the dates to the nearest relative date part, that’s just how I explain it easily.
Date part can be a parameter.
DATEPART(date_part, date, )
NO I Don’t mean the Function Datepart.
DATETRUNC(date_part, date, )
YES I Mean Date_part, which is scattered in the calculation and easy enough to replace with a parameter full of date_parts. Now end user can play a bit more.
Optimization #5: remove max(date), add an end date parameter…
Remove {max(date)} or the subquery of max(date) explained above because you can give your end user the opportunity to change the end date using parameter.