In today’s data-driven economy, organizations continuously strive to leverage data for innovation and decision-making. Yet, this potential often collides with concerns around privacy, compliance, and responsible data use. Purpose-limitation—the core principle that personal data should be collected and processed only for specified, explicit, and legitimate purposes—is more than just compliance checkbox. Implementing effective purpose-limitation enforcement in data usage is becoming essential for maintaining customer trust, regulatory adherence, and ensuring sustainable competitive advantage. At Dev3lop, our experience in data engineering consulting illustrates clearly that mastering purpose-limitation requires a strategic blend of robust technology, clear governance, and a forward-thinking mindset. Below, we’ll explore how organizations can approach this critical concept proactively and strategically, turning limitations into strengths and compliance obligations into catalysts for innovation.
What is Purpose Limitation, and Why Does it Matter?
Purpose limitation refers explicitly to the practice of collecting, processing, and utilizing personal data only for clearly defined and communicated objectives. Emerged strongly in frameworks like GDPR, CCPA, and other international data protection standards, it’s not merely a compliance necessity but part of the foundation of data privacy and business ethics. It’s about ensuring transparency: where data originates, how it’s processed internally, and ultimately how it aligns with customer expectations and compliance requirements.
For organizations, overlooking purpose limitation is not a viable business reality. Companies could face fines, reputation damage, loss of consumer trust, and inhibited ability to innovate due to regulatory barriers. Moreover, today’s informed consumers gravitate towards brands respecting their privacy and genuinely committed to responsible data practices. Purpose limitation enforcement offers peace of mind to stakeholders and proves strategically advantageous when seeking long-term, sustainable growth.
At the same time, clear purpose-limitation strategies guide the organization away from inefficient data clutter. By clearly stating and managing why data is collected and processed, businesses can strategically avoid unnecessary storage and processing complexities, which often trigger issues such as data skew (explained in our article about data skew detection and handling). In short: explicit purpose-limitation practices optimize both data privacy and operational efficiency simultaneously.
Building Robust Technical Controls to Support Purpose Limitation
Enforcing purpose limitation successfully requires robust technical safeguards embedded throughout your data architecture. A well-engineered environment can drastically simplify regulatory adherence, minimize human error, and instantly flag unintended data usages. Your technology stack needs controls ensuring collected data aligns appropriately with your stated purposes.
From a technical angle, leveraging advanced analytics platforms, data cataloging, lineage tracking, and audit mechanisms are indispensable ways to maintain clarity around data’s original intentions. Implementing clear data tagging, labeling, and intelligent access management prevents both intentional data misuse and inadvertent mistakes. For organizations, investing wisely in secure and transparent data warehousing solutions significantly streamlines adherence to purpose limitation, improving both compliance effectiveness and data governance.
Engaging an experienced partner specializing in data engineering ensures that your organization’s data architecture and pipeline align seamlessly with explicit purpose-limitation requirements from day one. Professionals look closely at data flows, integrations, and transformations to ensure conformity across the entire technological ecosystem. Such controlled infrastructure allows swift response to changes in regulatory landscapes, making sophisticated data usage both smarter and safer.
Governance and Organizational Culture: Ensuring Long-Term Compliance
Enforcing purpose limitation is not simply a separate compliance exercise, but a fundamental shift toward an enlightened organizational culture. Organizational governance, alignment of internal stakeholders, and continued education and communication are crucial components for achieving enduring purpose-limitation success.
Effective purpose-limitation governance includes creating clearly defined, communicated policies, and empowering all stakeholders through knowledge, transparency, and clear responsibilities. With a strategic approach to a robust data governance framework, businesses can operationalize purpose limitation by extending clearly defined roles, accessible guidelines, and integrated accountability processes. Here, fostering focused, informed, and purpose-aware teams translates governance from mere compliance to genuine cultural strength.
Furthermore, cultivating a data awareness mentality throughout your entire organization encourages employees and management alike to think purposefully about the implications of data collection, processing, and dissemination. Consider working with a nimble consultancy; our blog piece Working with a Small Data Consultancy: The Advantages explains why specialized experts can build customized governance policies rapidly and effectively—transforming the seemingly intimidating landscape of data governance into impactful business advantage.
Analytics Innovation within the Boundaries of Purpose Limitation
A common misunderstanding around purpose limitation is assuming it inherently limits analytic innovation and data experimentation. On the contrary, the clear policies delivered by well-applied principles of purpose limitation actually help teams innovate with more defined focus and clarity.
When purposes of collected data are clearly defined, analytics and innovation teams benefit greatly. Understanding precise limitations reduces confusion and allows teams to confidently develop targeted analytic models, drill-down interactions, and visualizations expressly designed to leverage available data within appropriate bounds. Our article on Implementing Drill-Down Navigation in Hierarchical Visualizations demonstrates how explicit data purpose can align with analytic expertise to meaningfully engage users and stakeholders alike.
Furthermore, teams clearly focused on purpose limitations tend to intelligently design API solutions. Consider, for instance, our comprehensive resource Monster-ly Comprehensive API Guide for Everyone, which details robust API development practices capable of embedding purpose-limitation safeguards directly in solutions themselves. Ultimately, clear purpose-limitation boundaries can lead organic innovation, streamlining data creativity and enriching solution-building potential.
Leveraging AI and Automation Techniques to Strengthen Enforcement
With the evolving landscape of artificial intelligence and intelligent automation, strengthening your purpose-limitation enforcement strategy becomes increasingly viable through advanced technologies. AI technologies, when integrated properly into your data infrastructure, bolster real-time compliance controls, proactively identify anomalies, and facilitate compliance tasks easier than ever before. The burgeoning popularity of powerful tools like ChatGPT, explored extensively in our article Exploring 20 Use Cases Where ChatGPT Can Help Small Businesses, underscores just how accessible advanced AI solutions have become—allowing small to midsize organizations alike to achieve sophisticated enforcement practices.
Automated continuous monitoring and real-time anomaly identification offer remarkable benefits by significantly improving purpose-limitation implementation. From detecting suspicious access patterns to identifying unexpected data attributes or unusual combinational data usage, AI solutions aid your compliance enforcement significantly, offering unmatched accuracy, versatility, and scalability.
When joined with human expertise, AI-driven solutions yield ideal results for purpose limitation, blending the rigorous oversight required by compliance frameworks with innovative, future-oriented capabilities. Investing strategically in intelligent automation and AI solutions positions the business to move compliance forward from an obligatory inconvenience to a powerful tool of inventive distinction.
Preparing for Future Data Challenges Through Proactive Purpose-Limitation Practices
Fostering proactive purpose limitations today enables preparation for tomorrow’s challenges and opportunities. Organizations prepared now with robust purpose limitation frameworks, technical governance measures, and cultural reinforcement approach the future agilely and effectively. Proactively embedding these best practices today equips your organization to handle regulatory transitions, customer expectation shifts, and emerging technologies confidently and without disruption.
This strategic preparedness positions companies to swiftly address new regulations, stakeholder expectations, or international compliance challenges that may arise. Companies that embed purpose limitations into processes, tools, and culture proactively can pivot swiftly, turning emerging market challenges into competitive advantages. Incorporating strategic data engineering expertise enables organizations to transform purpose limitation from regulatory burden into sustained organizational strength and efficiency.
Ultimately, purpose limitation isn’t a short-term compliance effort to address when specific regulations appear daunting. Rather, it’s an ongoing investment into the strategic alignment, transparency, and responsible data usage practices essential for long-term organizational success.
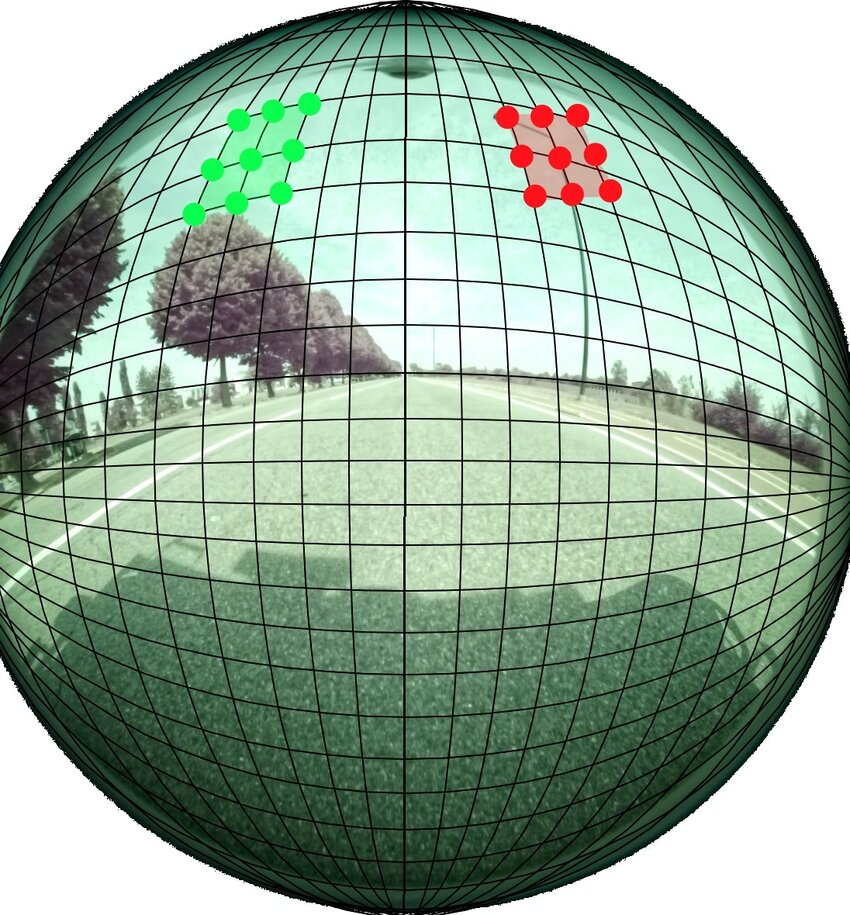
In the modern landscape of data analytics and visual exploration, the ability to quickly isolate critical insights within extensive datasets can be a major determinant of competitive advantage. Imagine if you could swiftly zoom into a critical data insight without losing the overall perspective of the broader context. The fisheye distortion approach makes this possible, simulating the effect of a magnifying glass that enhances your focal area while maintaining peripheral visibility. When properly implemented, fisheye techniques offer decision-makers, analysts, and innovators a superior way to navigate large datasets, ensuring they never lose sight of critical context. In this article, we explore this method’s core principles, advantages, potential use-cases, and technical considerations that empower decision-makers with advanced data visualization capabilities.
Understanding Focus+Context Visualization and Fisheye Distortion
“Focus+Context” visualization, in simple terms, enhances user experience by enabling simultaneous detail-oriented exploration and broader contextual awareness. Traditional visualization methods often require users to zoom in excessively, causing them to become disconnected from crucial surrounding data. This dilemma is where fisheye distortion techniques shine. The method primarily leverages nonlinear scale transformations, presenting regions around focal point data in finer detail, while regions farther away shrink progressively to maintain systemic visibility.
Fisheye distortion, adopted from the natural optics of fish eyes, leverages the power of perceptual psychology, allowing software to mimic human visual perception. It magnifies the user’s focal area while retaining contextual representation of the overall dataset. This visualization approach ensures analysts never become isolated in limited data viewpoint—instead, they remain contextually aware, evaluating details and relationships securely within the scope of the entire dataset.
Today’s data-intensive organizations, particularly those leveraging complex databases such as SQL server environments, can greatly benefit from fisheye distortion. Our Microsoft SQL server consulting services provide the expertise needed to efficiently integrate advanced data visualization systems, including fisheye methodologies, resulting in smoother analytics processes and decision-making capabilities.
The Technical Foundation: Fisheye Mathematical Formulations
At its core, fisheye distortion relies upon mathematical transformations such as nonlinear scaling functions to distort spatial representations intentionally. A conceptual variation of the “degree-of-interest” (DOI) function, developed through works of information visualization pioneers like George Furnas, commonly defines areas of interest by combining parameters such as the user’s focal point and the dataset context.
The DOI function typically calculates a value determining how much emphasis or visual magnification to apply at specific dataset coordinates. The equation usually integrates both the intrinsic importance of a data item (often called its “a priori” interest) and extrinsic importance based on proximity or relevance to a focused area. Thus, objects near the user’s point of interest get emphasized prominently, scaling down smoothly toward peripheral areas. Applied effectively, this mathematical model delivers visually appealing, intuitive, and interactive displays.
Moreover, carefully engineered fisheye implementations allow for flexibility and customization. Engineers can fine-tune how distortion behaves with user interactions, ensuring robustness and value. Building a data-intensive system optimized for interactivity involves significant engineering challenges. You can review how our team approaches scaling complex data platforms capable of handling massive daily interactions in our recent data engineering case study.
Applications in Real-world Decision-Making
Fisheye distortion serves well across various industries and contexts, particularly where quick and precise navigation of large datasets is crucial. For example, financial organizations dealing with vast market data find value in fisheye visualizations. Traders can instantly highlight market anomalies or fluctuations without losing their grasp on overall trends and pricing movements.
Cybersecurity teams empowered by fast-paced analytics tools can visualize extensive data streams contextually, instantly detecting and reacting to threatening anomalies. Read more about the power of real-time data streaming approaches in fraud detection scenarios in our article, The Role of Data Streaming: Stopping Fraud Before It Happens.
Beyond finance and cybersecurity, fisheye distortion offers profound advantages in consumer data analytics. Retail organizations can identify consumer buying patterns and market shifts while visualizing intricate relationships between revenue streams, sales channels, and individual customer segments. This holistic yet targeted approach drastically improves executive-level clarity and decision-making suitability.
Companies within tech-savvy business communities, such as those in tech hubs like Austin, are utilizing advanced analytics practices. To better understand industry trends and data-driven operations improvements, consider our insights into how Austin-based companies are using data analytics to improve their operations.
User Experience and Fisheye Visualization Tools
User experience (UX) plays an essential role in data visualization applications. Excellent UX facilitates smooth interactions while keeping visual clutter minimized. With fisheye distortion techniques, interfaces can offer intuitive zooming mechanisms and responsive transitions. This simplicity allows users to instantaneously alter their area of interest without sudden disruptions or visual disorientation.
Efficient implementation of a fisheye interface goes beyond elegance; it requires thoughtful inclusion within interaction and visualization design workflows. Navigating data and characteristics effortlessly through interactive fisheye interfaces enables users to focus their cognitive energy on insight extraction rather than manipulation frustrations.
Organizations interested in embracing fisheye-style visualization for their data visualization solutions can benefit from pairing it with storytelling-driven visualizations that resonate deeply with stakeholders. Discover more about enhancing analytics with compelling visual storytelling in our article dedicated to The Art of Storytelling Through Data Visualization.
Overcoming Common Challenges and Ethical Implications
While fisheye distortion brings groundbreaking improvements to large-scale data analysis, it is vital for decision-makers to recognize and overcome potential challenges. For newcomers, the nonlinear scaling involved can occasionally introduce confusion if applied without essential limits, potentially obscuring important insights unintentionally.
Ensuring users understand how fisheye visualization works and offering options to adjust distortion levels are key to successful deployment. Engineering teams will benefit from robust testing processes to discover the optimal balance between context visibility and focal-area magnification, avoiding potential pitfalls.
Furthermore, ethical considerations in presenting distorted visualizations must not be neglected. For decision-makers, understanding data context and sharing transparency in representation is critical. Highly interactive visualizations may unintentionally bias users if not designed appropriately, potentially skewing data-driven decisions. Explore more about the significant role ethics plays in creating trustworthy analytics systems in our article detailing Ethical Considerations in Data Engineering and Analytics.
Integrating Fisheye Visualizations: CI/CD and your Analytics Workflow
An essential part of deploying sophisticated visualization solutions like fisheye requires solid software engineering practices. Establishing and maintaining these complex visual analytics components demands a well-structured backend and release pipeline. Continuous Integration/Continuous Deployment (CI/CD) ensures you can reliably update and enhance visualization systems without interruptions or downtime.
Effectively leveraging CI/CD within the fisheye visualization pipeline helps maintain usability, stability, and rapid deployment capabilities in response to changing business needs. If you’re unfamiliar or looking to enhance your current deployment processes, our team provides a comprehensive guide on proper CI/CD deployment strategies. Read about best practices for establishing continuous integration and delivery processes in-house on our helpful tutorial: Building Your CI/CD Pipeline: A Comprehensive Guide.
Conclusion: Driving Intelligent Decisions Through Effective Visualization
Fisheye distortion for focus+context visualization is about harnessing accuracy and context without sacrificing one for the other. It empowers organizations to enhance productivity and clarity, reducing cognitive load and interactivity complexity. Embracing the power of targeted innovation in visual data exploration allows data teams and organizations to arrive at value-driven insights rapidly.
When paired with expert guidance, advanced analytics, and experienced data engineering, fisheye distortion enables organizations to scale visual data exploration to new heights—driving deeper insights, expanded analytics capabilities, and sharper strategic decision-making.
In an era marked by data ubiquity and real-time analytics, decision-makers require dynamic dashboard solutions that transcend static visualizations. Static dashboards provide insights, but truly innovative businesses require interactive solutions that enable on-the-fly exploration. Implementing interactive crossfiltering within multi-chart dashboards provides executives and data specialists alike with a powerful toolset to perform ad-hoc analysis, discover hidden patterns, and streamline informed decision-making. At our software consulting firm, we’ve witnessed firsthand how robust interactive crossfiltering transforms analytical capabilities, empowering organizations to dig deeper into their data narratives efficiently and intuitively. Leveraging interactive data visualization techniques provides exceptional efficiencies, granting stakeholders an intuitive, seamless means to dissect complex datasets and enabling rapid decision-making in today’s fast-paced business environment.
Understanding the Core Concept—Crossfiltering Explained
Interactive crossfiltering refers to a mechanism in advanced dashboarding where selecting a data element in one chart filters data presented visually across all linked charts. Simply put, crossfiltering emphasizes interactivity; any data-driven selection performed in one visualization dynamically updates others, allowing users to quickly pinpoint correlations, trends, and anomalies. Instead of analyzing chart-by-chart individually, this holistic approach delivers a complete, integrated view, thus significantly enhancing the analytical power of data-driven dashboards.
Implementing effective crossfiltering entails establishing clear relationships between different elements within data sets. Strategic data engineering is essential here, requiring a robust understanding of data schemas, table relationships, and SQL table modifications. When carefully designed, interactive crossfiltering is transformative, as users seamlessly filter vast amounts of data merely through intuitive visual touchpoints.
Furthermore, it’s important to differentiate between static visual inventories and dashboards that ‘talk.’ Successful interactive crossfiltering depends highly on data pipelines continually updating analytics in real-time or near-real-time. Strategic pipeline execution planning ensures the data supporting interactivity is reliable, accurate, and suitable for meaningful exploration. Organizations that neglect proper data engineering consulting in Austin, Texas or globally risk deploying dashboards incapable of delivering real-time and interactive insights.
The Business Case—Why Interactive Crossfiltering Matters
Business leadership increasingly demands quick answers to pressing questions. Static dashboards—while informative—often fall short in swiftly delivering actionable insights as business dynamics shift throughout the working day. Interactive crossfiltering, on the other hand, greatly reduces the latency between posing queries and receiving relevant analysis. Visual analytics delivered through intuitive user interactions enable decision-makers to adapt quickly to changing landscapes, granting them a considerable competitive advantage.
Consider complex business scenarios such as sales pipeline monitoring, demand forecasting, or inventory management. Implementing crossfiltering allows stakeholders to drill effortlessly into relevant dimensions or metrics—for example, viewing product demand through regions, dates, or sales channels. Decision-makers gain an unprecedented capability: making efficient, data-driven strategic decisions that optimize inventory levels or operational efficiency. Our experience in optimizing inventory levels through demand forecasting highlights precisely how interactive crossfiltering significantly enhances insights for inventory management.
Moreover, interactive dashboards empower non-technical users to perform intricate analyses without deep programming or SQL knowledge. Crossfiltering democratizes data access, shifting responsibilities from overloaded data analysts and data engineers, and providing business users more direct control. Consequently, analytics teams improve focus on developing innovative models, leveraging data-driven decision making strategies, instead of manually processing repeated analytics requests.
Key Technical Considerations in Crossfilter Implementation
Implementing interactive crossfiltering requires careful technical planning. Data engineers, dashboard architects, and visualization specialists must come together in crafting solutions that support seamless cross-chart communication. Ensuring efficient data flows, optimizing querying mechanisms, and structuring data scientifically all become foundational concerns for reliably functional crossfiltering.
Organizations should begin the technical implementation with careful emphasis on data modeling best practices, optimizing schemas for quick querying performance. It may involve thoroughly analyzing backend systems to identify potential bottlenecks, usability concerns, or constraints limiting crossfilter performance. Proper alignment with database systems—whether utilizing PostgreSQL or SQL Server—is crucial, as our experts discuss in depth regarding differences between PostgreSQL and SQL Server. This strategic alignment enables faster responses to filtering queries and streamlines real-time interactivity.
Another pivotal technical consideration is setting the scope of interactivity. Too many filters or overly complicated filtering conditions can confuse end-users and degrade performance. Interactive crossfiltering implementation must balance between providing users meaningful flexibility and maintaining visual simplicity and responsiveness.
Enhancing Crossfilter Dashboard Performance Through Innovation
As organizations scale dashboard usage, they frequently experience performance degradation. Complex dashboards are data-intensive, requiring strategic use of efficient data processing and visualization solutions. Many organizations face performance issues not because interaction capability is insufficient, but rather as the scalability of their dashboards becomes limited by data processing overhead. Here, innovative solutions, such as knowledge distillation techniques for lightweight dashboard models, come into focus, allowing enterprises to streamline and optimize performance of large-scale interactive dashboards.
Further innovation can come from executing advanced data engineering strategies, including real-time event processing and analytical workflows. As explained in our data engineering case study scaling to handle billions of events daily, robust infrastructure ensures that interactive dashboards reliably perform when data is being constantly refreshed at high volumes.
Cloud-based infrastructure and modern data platforms provide scalable solutions, considerably reducing latency when implementing crossfiltering functionality. Carefully crafted data-driven backends and cloud solutions empower businesses to dynamically and interactively engage with vast datasets without compromising performance, even during peak analytical loads.
Best Practices for User-centric Interactive Dashboard Design
Building dashboards that truly resonate with end-users involves another profound dimension—in-depth user experience (UX) design considerations. Effective interactive crossfiltering dashboards emphasize minimalism, clarity, intuitive navigation, and user-friendly interfaces. Unsurprisingly, simpler user interfaces minimize training overhead, reduce confusion, and ensure user productivity.
The design of interactive dashboards, therefore, must factor in user needs clearly. Following a progressive disclosure approach, users are initially presented streamlined, simplified data summaries and allowed to delve deeper into data layers when desired. Consistent user feedback mechanisms must inform interactive design, enabling dashboards to evolve over time to meet evolving business requirements.
Additionally, comprehensible visual feedback mechanisms are crucial when employing crossfiltering. Users need clear acknowledgment of their selections’ impact across the dashboards to avoid confusion. Transparency throughout user interaction sequences confirms user actions and helps clearly communicate filtering logic.
Unlocking the Full Potential of Data-driven Dashboards through Expert Partnership
Interactive crossfiltering promises powerful insights, accelerated decision-making, and unprecedented analytical freedom. However, deploying effective solutions requires specialized expertise, sophisticated data engineering methodologies, in-depth strategic planning, and careful implementation that matches end-user requirements. Partnering with proven data and analytics experts ensures the full realization of your interactive dashboards’ potential.
As data engineering consulting experts in Austin, Texas, our team possesses extensive hands-on experience and insights necessary for driving innovation and strategic analytics deployment. We emphasize holistic approaches embracing infrastructure, usability, data engineering, and innovative analytical methodologies. For support unlocking interactive dashboard potential, consider exploring our data engineering consulting services.
Interactive crossfiltering can revolutionize your analytical capabilities—transforming data-driven decision-making from static to dynamic, reactive, and exceptionally strategic methodologies. Seizing opportunity means harnessing sophisticated analytics interactivity intelligently, intentionally—and with expert implementation guidance.
In today’s rapidly evolving data landscape, the ability to efficiently handle data insertions and updates—known technically as upserts—is crucial for organizations committed to modern analytics, data integrity, and operational excellence. Whether managing customer details, real-time analytics data, or transactional information, a robust upsert strategy ensures consistency and agility. Understanding how upsert implementations differ across various data stores empowers strategic technology leaders to select the optimal platform to sustain data-driven growth and innovation. This blog post provides clarity on common upsert patterns, highlights pertinent considerations, and guides informed decision-makers through the architectural nuances that can shape successful data practices.
What is an Upsert?
An upsert—a combination of “update” and “insert”—is an operation in database management that seamlessly inserts a new record if it does not already exist, or updates it if it does. By merging two critical database operations into one atomic task, upserts simplify application complexity, optimize performance, and ensure data integrity. Understanding the power behind this hybrid command allows technology leaders to implement structured solutions streamlined around efficient data management.
Upsert logic plays a pivotal role across a vast spectrum of applications from real-time analytics dashboards to complex ETL pipelines. Efficient implementation significantly speeds up data synchronization, enhances data accuracy, and simplifies transactional handling. Rather than relying on separate logic for insert-and-update scenarios, businesses can encapsulate complex logic within scalable applications. Leveraging upserts appropriately can unlock productivity gains, ensuring development resources remain available for higher-value activities focused on business goals rather than routine technical intricacies. An optimized upsert strategy streamlines your data architecture and amplifies operational efficiencies.
Upsert Strategies in Relational Databases
Traditional SQL Databases and Upsert Techniques
In the relational database landscape—dominated by SQL-based platforms like PostgreSQL, MySQL, SQL Server, and Oracle—several standardized methodologies have emerged. Platforms usually implement specialized SQL commands such as “INSERT INTO… ON DUPLICATE KEY UPDATE” for MySQL or “INSERT INTO… ON CONFLICT DO UPDATE” in PostgreSQL. SQL Server utilizes the “MERGE” statement to cleverly handle parallel update and insert requirements, whereas Oracle similarly employs its powerful “MERGE INTO” syntax.
Leveraging these built-in relational database mechanisms provides reliable transaction processing, ensures data integrity rules are strictly enforced, and reduces complexity—thus enabling agile data teams to design powerful business logic without complicated boilerplate. Decision-makers adopting SQL-centric data architecture benefit from the simplified yet robust nature of regularized upsert logic, ensuring processes remain streamlined and maintainable.
Additionally, understanding fundamental SQL concepts such as the differences between UNION and UNION ALL can significantly enhance a technology team’s capabilities in structuring intelligent, performance-focused upsert solutions within relational environments.
NoSQL Databases: Understanding and Optimizing Upserts
MongoDB and Document-Based Stores
NoSQL Databases, typified by MongoDB, Cassandra, or Couchbase, favor flexibility, scalability, and agile schema design compared to traditional SQL databases. Among these, MongoDB upserts have gained prominence as a critical operational tool, using commands like “updateOne()”, “updateMany()”, or “findAndModify()” with the upsert:true option to facilitate efficient self-contained updates or inserts.
MongoDB’s efficient handling of native JSON-like document structures supports agile data mapping, enabling rapid development workflows. Development teams often find this dramatically simplifies data ingestion tasks associated with modern applications, real-time analytics, or IoT monitoring scenarios. Moreover, NoSQL upsert capabilities smoothly align with Node.js implementations, where flexible, lightweight data manipulation via MongoDB drivers helps foster streamlined data pipelines. For expert Node.js development guidance, you might explore our specialized Node.js consulting services.
Beyond mere performance gains, NoSQL platforms offer inherent fault tolerance, geographical data replication, and scalability across extensive datasets—key features for organizations focused on innovation. Purposeful upsert implementation in this domain provides an effective way to leverage NoSQL readiness for evolving business requirements and dynamic schema changes.
Cloud Data Warehouses: Optimizing Analytics Workflows
Redshift, BigQuery, and Snowflake Upsert Techniques
Cloud-native data warehouses such as AWS Redshift, Google’s BigQuery, and Snowflake streamline analytical workflows, leveraging massive scalability and distributed computing advantages. Upserting in these platforms often involves distinct replacement or merging approaches through SQL commands or platform-specific functions. For example, BigQuery offers MERGE operations tailored to effortlessly consolidate enormous datasets with impressive efficiency and accuracy.
Leveraging upserts within cloud data warehouses becomes especially beneficial in ELT (Extract, Load, Transform) architecture, which has consistently demonstrated powerful results in real-world analytical applications. Dive deeper into why this matters through our article covering real-use cases where ELT significantly outperformed ETL. Cloud data warehouses function impeccably within ELT workflows due to their capability to manage massive-scale merges and incremental refresh scenarios effectively.
Strategically selecting modern, cloud-native platforms for enterprise analytics, complemented by carefully planned upsert approaches, empowers analytic teams and improves query performance, data freshness, and overall agility. Effective upsert strategies in cloud environments ultimately drive organizational competitiveness and informed decision-making via timely, actionable insights.
Real-Time Upserts in Streaming Platforms
Apache Kafka and Stream Processing Solutions
Modern businesses increasingly depend on capturing and leveraging real-time data to maintain competitive advantages. The burgeoning importance of event-streaming platforms like Apache Kafka, coupled with message processing systems such as Apache Flink, Apache Beam, or Node.js-based frameworks, makes real-time upsert handling critical.
Stream processing solutions allow companies to execute operations that blend incoming data streams with existing data. Apache Kafka’s KTable abstraction, for example, elegantly supports event-sourced logic, ensuring data changes progressively update existing states rather than overwriting entire datasets. This real-time operational transparency notably enhances user experience and maintains privacy integrity—an aspect detailed further in our analysis of data privacy in fintech.
Implementing efficient real-time upserts can translate into meaningful benefits ranging from near-instantaneous financial transaction reconciliations to dynamic personalization in user dashboards. Businesses wielding the power of event-driven patterns combined with intelligent upsert practices drastically improve data immediacy, accuracy, and responsiveness.
Upsert Challenges and Best Practices
Avoiding Pitfalls in Implementation
Implementing an efficient upsert strategy requires understanding common challenges—such as performance bottlenecks, concurrency conflicts, and schema management. One common challenge arises when complex data transformations and pipeline dependencies create cascading impacts across data ingestion—a topic explored further in our article, fixing failing dashboard strategies. Clearly defining update-vs-insert hierarchies, ensuring unique identifier integrity, and handling conflicts predictably with minimal performance impact are key considerations in navigating pitfalls.
Best practices for handling upsert conflicts include careful management of unique constraints, smart indexing strategies, leveraging transactions for consistency, and choosing the appropriate database or data pipeline mechanisms. Businesses will benefit significantly by investing time upfront in understanding how their chosen platform aligns with core application data needs, analyzing real-world use cases, and planning capacity and concurrency limits.
Clearly articulated policies, well-defined procedures, and understanding your analytical goals shaped by informed strategic implementation set positive directions. To further foster consumer trust in accurate data handling, teams can explore our best-practice advice for enhancing user experience through clear privacy policies.
Conclusion: Strategic Upserts Drive Innovation and Efficiency
An effective upsert strategy transforms analytical workflows, optimizes data-driven agility, and provides businesses with significant competitive advantages. Choosing the correct upsert implementation strategy demands assessing your business goals, evaluating workloads realistically, and understanding both relational and NoSQL data nuances.
When implemented strategically, an optimized upsert solution strengthens data pipelines, enables insightful analytics, and powers impactful innovation across your organization. Explore several practical examples through our detailed report: Case studies of successful ETL implementations.
In today’s competitive market where data volume and complexity grow exponentially, organizations must leverage advanced technical strategies to maintain efficiency and innovation. As data ecosystems become increasingly intricate, parallel processing emerges as a crucial technique to achieve rapid data analysis and accurate real-time insights. Among several parallel computing patterns, Fan-Out/Fan-In represents a scalable and robust architecture designed to maximize parallelism, reduce latency, and simplify complex processing tasks. Decision-makers tasked with optimizing data pipelines and improving analytical capabilities will find that implementing Fan-Out/Fan-In patterns not only streamlines data processing activities but also enhances operational visibility, significantly driving informed decision-making across multiple industries.
What is Fan-Out/Fan-In, and Why Does It Matter?
Fan-Out/Fan-In is a parallel processing pattern that allows data engineers to break complex data tasks into smaller tasks, execute them simultaneously (Fan-Out), and then aggregate the results back into a unified outcome (Fan-In). Unlike linear or sequential processing, Fan-Out/Fan-In leverages the power of distributed systems to enable concurrent operations. This pattern ensures scalable performance and optimal resource utilization even when processing massive volumes of data—a core capability for enterprises seeking agility and real-time responsiveness.
Implementing Fan-Out/Fan-In is especially critical for businesses addressing modern data demands where timely insights can significantly amplify a competitive advantage. Whether processing streaming data, batch operations, or performing complex analytical computations, the Fan-Out/Fan-In pattern dramatically accelerates performance while maintaining accurate and coherent results.
However, to effectively adopt this parallel processing model, decision-makers need strategic alignment with experienced expertise, such as utilizing our Data Engineering Consulting Services to navigate intricate architecture considerations and optimize outcomes aligned with your organizational objectives.
Practical Applications: Integrating Fan-Out/Fan-In into Data Pipelines
The versatility of Fan-Out/Fan-In allows for effective integration into diverse data scenarios. Typical business applications include real-time analytics, fraud detection, manufacturing analytics, and supply chain optimization. For instance, financial sector companies commonly utilize a Fan-Out architecture to execute simultaneous processing tasks across large transaction volumes, immediately identifying anomalies or fraudulent activities. By leveraging parallelism and subsequently aggregating results through a Fan-In approach, organizations significantly improve detection timeframes and response efficiency.
Additionally, Fan-Out/Fan-In principles are easily adopted into analytics-focused workflows. For instance, when enterprises conduct complex analytical functions within a data lakehouse environment, parallel processing via this pattern significantly improves analytical readiness, supporting timely decisions. Understand deeper implementation guidelines by exploring our expertise captured in Data Lakehouse Implementation: Bridging the Gap Between Lakes and Warehouses.
Design Considerations When Applying Fan-Out/Fan-In
Implementing Fan-Out/Fan-In requires thoughtful system architecture design, ensuring robustness, performance efficiency, and optimal resource utilization. The most critical aspect of effectively leveraging this pattern involves carefully analyzing how tasks can be partitioned logically. The goal in Fan-Out processing is to create balanced segmentation of tasks—each performing roughly equal workloads—allowing parallel streams to optimize computational resources and minimize idle times.
System design should also carefully manage data dependencies and synchronization requirements in the Fan-In phase. Successful Fan-In gathers the parallel outputs from the distributed tasks accurately, ensuring integrity and consistency. Strategies to proficiently handle synchronization include using properly configured event-driven architectures, optimized queuing solutions, and sophisticated workflow orchestration tools. To master the principles behind building well-constructed workflows and deliver predictable outcomes, organizations must elevate their technical prowess or partner with experts who understand the nuanced implementations necessary for optimum performance.
Leveraging advanced technologies can further streamline efficiency in parallel pipeline configurations. For instance, intelligently using range filtering can significantly reduce processing overhead by targeting the exact subsets of data required for specialized computations. This ensures data flows seamlessly and efficiently between multiple nodes. For additional insights into structuring more precise selection criteria in parallel tasks, consider our insightful guide on Mastering Range Filtering with the SQL BETWEEN Operator.
Challenges to Anticipate When Adopting Fan-Out/Fan-In Patterns
While Fan-Out/Fan-In provides powerful capabilities for parallel processing, decision-makers must anticipate several technical and operational challenges. One frequent challenge is ensuring workload distribution remains even across processing nodes. If tasks aren’t evenly distributed—whether due to data inconsistency or improperly assessed complexity—processing performance can degrade, negatively impacting the overall advantage provided by parallel execution.
Additionally, the increasing complexity of distributed systems introduces greater overhead in handling errors, managing retries in failed tasks, and ensuring task consistency. The Fan-In stages of data aggregation also add complexity as synchronization overhead must be thoroughly planned and addressed during architectural design phases; failure to manage this appropriately introduces unnecessary latency or discrepancies in data.
Organizations aiming for seamless and efficient parallel implementations should consider utilizing advanced architectural solutions such as ZeroETL, offering promising frameworks toward real-time analysis without excessive complexity. Discover more about this innovative approach by browsing our strategic overview of ZeroETL Architectures – The Future of Real-Time Analytics.
The Importance of Scalability and Flexibility in Parallel Data Processing
Businesses do not benefit from rigid data architectures that fail to scale appropriately. Fan-Out/Fan-In patterns inherently deliver scalability and flexibility—advantageous for achieving growth in rapidly evolving business environments facing fluctuating workloads and increasingly diverse data needs. Scalability, notably attainable in Fan-Out patterns through parallelization, advises future-proofing capabilities, providing organizations essential elasticity during peak data periods or analytical processing surges, without necessitating substantial overhead increases in infrastructure or spend.
Furthermore, Fan-Out/Fan-In patterns mesh seamlessly with advancements in artificial intelligence and machine learning. AI-driven tools integrated within parallel data processing frameworks accelerate analytics and deliver innovative decision-making capabilities. As explored extensively in our article, AI-Powered Tools That Transform Decision-Making in 2025, embracing future technologies within established agile architectures enhances your organization’s analytics landscape, ensuring competitive advantages extend well into upcoming industry innovations.
Decision-makers looking toward robust, highly-scalable solutions can significantly benefit from adopting parallel patterns like Fan-Out/Fan-In, maximizing usage of available data resources strategically, without compromising performance or timeliness.
Summary: Strengthening Data-Driven Decisions with Fan-Out/Fan-In
Regardless of your organizational maturity or industry vertical, implementing Fan-Out/Fan-In methodologies positions your enterprise at a competitive intersection of innovation, agility, and efficiency. By consistently enabling timely, accurate insights and ensuring optimal infrastructure utilization through parallel processing, you gain unprecedented clarity in business environments driven by data.
As specialists in data, analytics, and innovation, we empower organizations to harness the transformative potential of advanced data capabilities effectively. Consider leveraging specialized expertise through our strategic approach to data engineering, analytics optimization, and tailored consulting solutions designed uniquely for your organization’s evolving needs.
Explore practical, industry-specific applications beyond standard solutions with our article on 11 Ideas for Using Data Analytics in Austin, Texas, and discover ways innovation easily becomes actionable when approached strategically.
Invest strategically in your data pipeline architecture. Unlock the full potential of Fan-Out/Fan-In for scalable, responsive, and efficient analytics.