ETL, or Extract, Transform, and Load, is a process used in data warehousing to extract data from various sources, transform it into a format that can be loaded into a target system or data warehouse, and then load it into the target system. This process is useful because it allows organizations to integrate data from multiple sources, clean and transform the data to make it consistent and compatible with the target system, and then load it into the target system for analysis and reporting.
There are several benefits to using ETL in data warehousing, including:
Improved data quality: By extracting data from multiple sources and cleaning and transforming it, ETL can help ensure that the data loaded into the data warehouse is accurate, consistent, and free of errors. This is important because data quality is essential for effective data analysis and reporting.
Increased efficiency: ETL can automate many of the manual tasks involved in data integration and preparation, making the process more efficient and reducing the time and effort required to load data into the data warehouse.
Flexibility: ETL allows organizations to extract data from a wide range of sources and transform it into a format that can be loaded into the target system. This means that organizations can easily integrate data from different sources and adapt to changing data requirements.
Scalability: As data volumes and the number of data sources grow, ETL can help organizations scale their data warehousing operations to accommodate the increased data.
ETL is a valuable tool for data warehousing because it helps organizations integrate, clean, and transform data from multiple sources and load it into the target system efficiently and effectively. This allows organizations to make better use of their data and improve their decision-making capabilities.
Using ETL can help organizations save time and resources by automating many of the manual tasks involved in data integration and preparation.
This can free up data analysts and other personnel to focus on more important tasks, such as analyzing and interpreting the data.
Another benefit of using ETL is that it allows organizations to implement data governance and security controls to ensure that the data in the data warehouse is accurate, secure, and protected from unauthorized access or tampering. By implementing these controls, organizations can help ensure that their data is reliable and can be trusted by stakeholders.
Furthermore, using ETL can also help organizations improve their data management capabilities. By integrating data from multiple sources and cleaning and transforming it, organizations can create a single, consistent view of their data that is easy to access and analyze. This can help organizations gain insights and make better decisions based on their data.
The benefits of using ETL in data warehousing include improved data quality, increased efficiency, flexibility, scalability, and improved data management. By using ETL, organizations can integrate and transform data from multiple sources and load it into their data warehouse efficiently and effectively, enabling them to make better use of their data and improve their decision-making capabilities.
It’s important to note that while ETL can be a valuable tool for data warehousing, it’s not the only solution.
ETL is one way to solve a problem. Being flexible to many variations is the key to solving advanced analytics data problems.
At times it’s easier to copy and paste, download a spreadsheet, and this is what we like to call “prototyping.” We need to start from somewhere.
And it’s good to know there are other approaches to data integration, depending on your data governance strategy, and preparation for data warehousing similar to ETL may be more suitable for some organizations, depending on their specific needs and requirements.
Some companies utilize EL, which is “extract” and “load” or a mixture of ETL, called ELT. Extract, load, then transform. This depends on what the solution needs or what your database/storage system allows.
In closing many organizations use an ELT (Extract, Load, Transform) approach, where data is extracted from the sources and loaded into the target system, and then transformed within the target system. This approach can be useful because it allows organizations to leverage the processing power of the target system, which can make the data transformation process more efficient and scalable.
Additionally, some organizations may choose to use a hybrid approach, where they use both ETL and ELT to extract, transform, and load data into their data warehouse.
No matter the mixture of letters data warehousing has not changed much in the last ten years outside of the keywords utilized to describe the solution.
Overall, the best approach to data integration and preparation will depend on the specific needs and requirements of each organization. However, using ETL can be a valuable tool for many organizations, as it can help them integrate, clean, and transform data from multiple sources and load it into their data warehouse efficiently and effectively.
ETL is a process in data warehousing that involves extracting data from various sources, transforming it into a format that is suitable for analysis, and loading it into a target database or data warehouse. This process is commonly used to integrate data from multiple sources into a single, centralized repository, making it easier to access and analyze the data.
In a typical ETL workflow, the first step is to extract data from various sources. These sources can include transactional databases, flat files, and other systems. The extracted data is then transformed, which typically involves cleaning and normalizing the data to ensure that it is consistent and in a format that can be easily analyzed.
After the data has been transformed, it is loaded into the target database or data warehouse. This typically involves creating tables and columns in the target system to match the structure of the transformed data, and then inserting the data into these tables.
There are many tools and technologies available for performing ETL, including open-source and commercial options. Some of the most popular tools include Apache Spark, Talend, and Informatica.
To get started with ETL, it is important to have a clear understanding of the data sources and the desired target format for the data. This will help you to design an effective ETL process that can efficiently and accurately extract, transform, and load the data. It is also important to have a solid understanding of SQL and other data manipulation technologies, as these will be essential for performing the transformations and loading the data into the target system.
ETL is a critical process in data warehousing, and a valuable skill for anyone working with large datasets. By understanding the basics of ETL, you can start to develop the skills and knowledge needed to effectively integrate and analyze data from multiple sources.
Once you have a solid understanding of the basics of ETL, you can start to explore more advanced concepts and techniques.
For example, you may want to learn about more complex data transformations, such as pivoting and unpivoting data, or dealing with nested data structures. You may also want to learn about different ETL design patterns, such as slowly changing dimensions and type 2 dimensions, which are commonly used in data warehousing.
In addition to learning more about the technical aspects of ETL, you may also want to explore the broader context of data warehousing and business intelligence. This can include learning about data architecture and design, as well as the role of ETL in supporting data-driven decision making.
As you gain more experience with ETL, you may also want to consider earning a certification in data warehousing or business intelligence. This can help to demonstrate your expertise in these areas, and can open up new job opportunities and career advancement.
Conclusively, there is a lot to learn about ETL, and the field is constantly evolving as new technologies and techniques are developed. By starting with the basics and continuing to learn and grow, you can develop the skills and knowledge needed to become an expert in ETL and data warehousing.
Thanks for learning more about ETL. If you need help, guidance, training, or solutions related to ETL services, please contact us for a quick discovery call.
When building a data source on Google Sheets in Tableau Desktop 10mb is the max per Google Sheet. However, what if we could connect to more than one Google Sheet at the same time?
Google Sheets works wonders with Tableau Public because it allows for Tableau Public to read data from Google Sheets once per day. This enables everyone the capability to use an online cloud data source to update their Tableau Desktop dashboards.
Introduction
In this blog, we will discuss connecting to multiple Google Sheets in one connection. If “large sheets removed” is not sufficient, and you’re willing to break apart your sheets into multiple sheets manually or with an engineer, we will find this article helpful. We break apart each element, how it works, and explain how your engineer may begin breaking down the solution.
Tableau currently has no built in feature to allow this to happen, however they do have a feature you can setup to make it automatically connect to Google Sheets! Tableau suggests this isn’t possible and the only way to make it work is to use LESS DATA, but what if you have big data?
We built this blog to help you begin the journey of connecting to many sheets. You will want to demo this as a possible solution to show your engineering team to automatically create these Google Sheets (we are here to help too).
Error explained
If you begin connecting to a Google Sheet in Tableau Desktop >10mb, you will see various popups, depending on your operating system, explaining an error has occurred with Google Sheets.
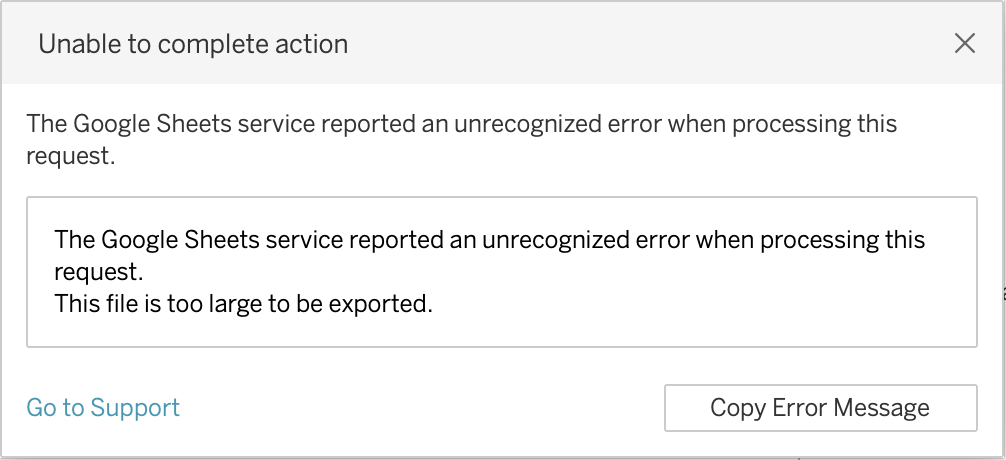
Unable to complete action error message
Did you recently see this error?
Unable to complete action
The Google Sheets service reported an unrecognized error when processing this request.
This file is too large to be exported.
An error occurred while communicating with Google Sheets, <10mb Google sheets error message in Tableau desktop.
A good question to start asking, “will my data split into other sheets easily?”
In the example below we are going to speak towards an 80mb Google Sheet that will not work in Tableau.
TechWorkaround explained
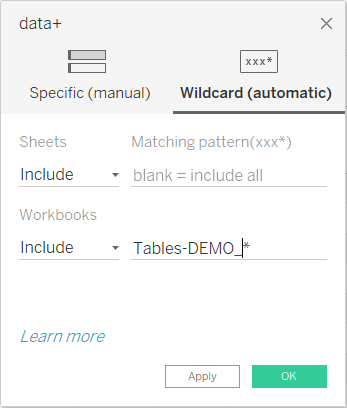
The Tableau Desktop Wildcard (automatic) feature will capture Google Workbooks (contains google sheets) and google sheets in a workbook(s). It will “automate” building connections to multiple 10mb workbooks or sheets, by establishing a stack of data that will resemble your end goals. Similar to using Union All in SQL.
Stone Working Analogy
If you’re unfamiliar with union in SQL, think of your data stacking on each other like bricks on a brick wall. Data engineers and brick wall experts have similar jobs. They are solving a problem by stacking side by side or on top of each other.
We will focus on a “workbooks” example, where we will stack bricks of data on each other.
Using a matching pattern(xxx*), we are able to union similar named data storage.
Example; there are four regions in our data, each region is <10mbs, about 80mb total.
Four regions:
SOUTH 10mb
NORTH 10mb
EAST 10 mb
WEST 50 mb*
A Use Case Explaining the Solution
Step 0; union means the sheets need the same column headers. Thanks for learning about unions!
Step 1; build 8 googlesheets… (new workbooks, not new sheets, this works with sheets however I’m using workbooks for now)
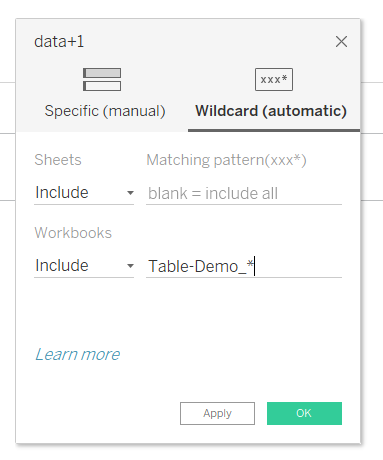
Step2; name each google sheet workbook “Table-Demo_EXAMPLE” etc… and you will have the following.
Table-Demo_SOUTH
Table-Demo_NORTH
Table-Demo_EAST
Table-Demo_WEST_1
Table-Demo_WEST_2
Table-Demo_WEST_3
Table-Demo_WEST_4
Table123-Demo_WEST_5
Protip; Table123-Demo_WEST_5 will not be included in this exercise because it’s not named Table-Demo_. Wildcard allows you the ability to filter to the things you need. If you name your Google Sheets “Table-Demo_” our wildcard solution automates connection to that google sheet, there’s no need to connect to the extra google sheet if you’re setting up the solution as explained.
Now that we have an understanding of how a wildcard will work, let’s discuss the end to end.
How to setup >10mb union
To increase size of google sheets greater than 10 megabytes, and increase your overall Google Sheets insights in tableau desktop, you need to get good with the Union wildcard!
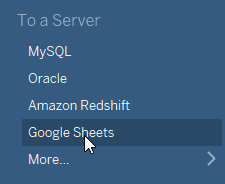
Connect to the googlesheet. Tableau desktop made this workflow a one click button on left side of opening screen. Requiring two clicks in total.
Walk through the Google authentication, choose which email with many similar tables for wildcard. This means you need to go and change the names of the Tables you wish to put together.
The renaming part needs to be a part of an automated process, you may want to do, using the Google Sheets API also known as the Google API, we found success automatically creating a new Google Sheet, and automatically naming the sheet similarly, which improved a client engagement during a tableau consulting engagement that had a lot of data engineering consulting to generate the solution. If data is constantly morphing, there may be a need to delete old sheets, we found clearing the sheet and re-populating data was the easiest method for fresh cleans. However lets get focused on the manual process because it’s a similar architecture. We found naming tables differently between tests helped us with testing/troubleshooting, and found Google Sheets had some strange hiccups that are easier to avoid by removing old tests completely.
Discussing Data Structure tips for >10mb Google Sheets
Here’s a good time to start making sure column headers are the same. If not it will continue to make a column, which will lead you down the path of learning how to solve for dynamic parameters due to string values being many to many.
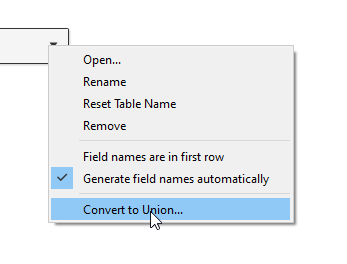
Convert to union…
Very important step, drop down carrot and find the Convert to union click.
This workaround allows you to connect once, to all sheets similarly named (using wild cards) VS connecting to all the different google sheet workbooks. This allows you to remove many data sources and transition into one data source.
The Wildcard Union Screen in Tableau
Tableau offers a feature to union more than one google sheet together, which enables users to quickly build large cloud data storages on Tableau public, or internally.
Example; Tables-Demo_* will find anything with Tables-Demo_ as the start of the sheet name.
Helpful related resources and documentation.
Below are documents, notes, and community posts from other Tableau authors.
The 10mb limit with Google Sheets is ambiguous when testing the number with true CSV file sizes and better to determine a way of “stopping” the data before it gets big.
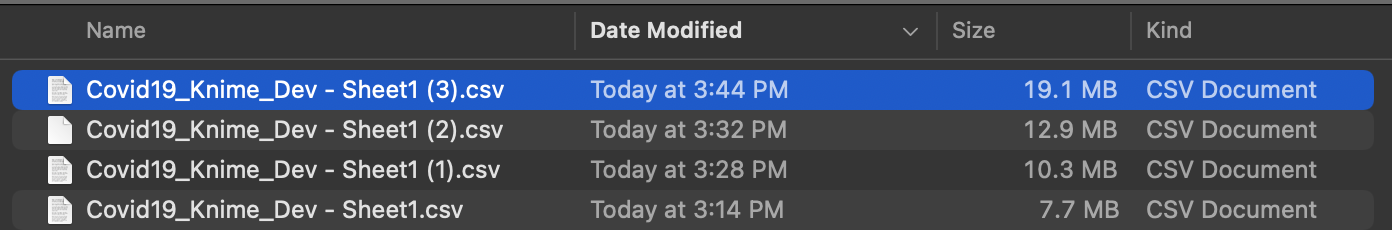
Some interesting things to think through, we found 7mb, 10.3mb, 12.9mb, and 19.1mb CSV files coming from single Google Sheet connections and no popup error stopping Tableau Desktop from connecting to the data. Don’t consider this size to be your break/test.
Screenshot demonstrating various CSV files downloaded from Google Sheets – Tested Oct 28, 2021
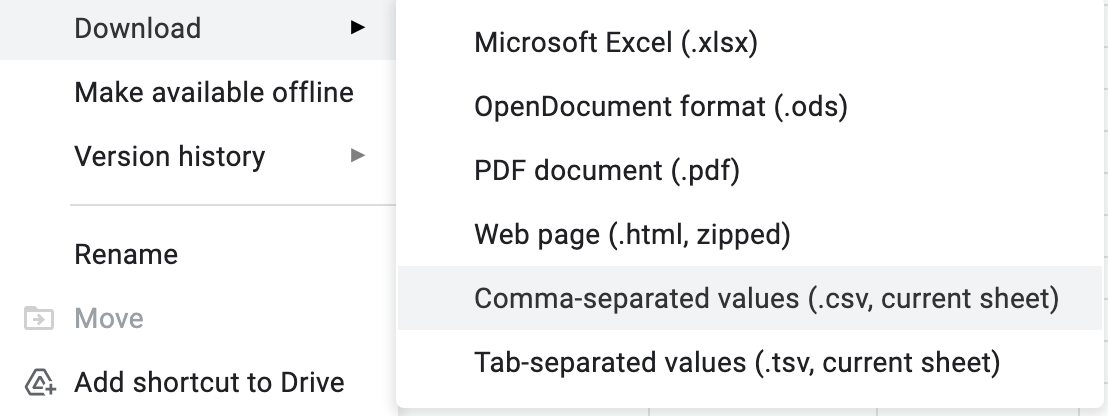
Good to note; This is the size of the csv when downloaded via the Google Sheets/Data/. Your team may get hung up on this process, and we found it’s better to focus on a row count if you’re not using full stack engineering to complete the task.
Thank you for reading. If you are interesting in implementing a process that uses Google API, contact us to learn more.
Researched & Written by, Tyler Garrett founder of Dev3lop | Consulting Services.
We have accomplished another milestone in our software, Canopys. Canopys v0.1.1 is coming soon, and I’m here to explain more about the application, the update, and the future.
Our software, canopies v0.1.0, is available on both Mac and Windows.
Also, we made Mac and Windows files available on the website; no sign is required to download the file. The sign-up is nested into Auth0, which handles all of our authentication. This is a significant step toward offering a file and gaining information from end users safely; we can’t see Auth0’s software managing any end users’ passwords and 100% of this.
We like auth0 for user authentication because it offers us a chance to focus on the product, not building and supporting a custom authentication solution, and this allows us to continue to drive innovations in the areas we feel are most important to growth.
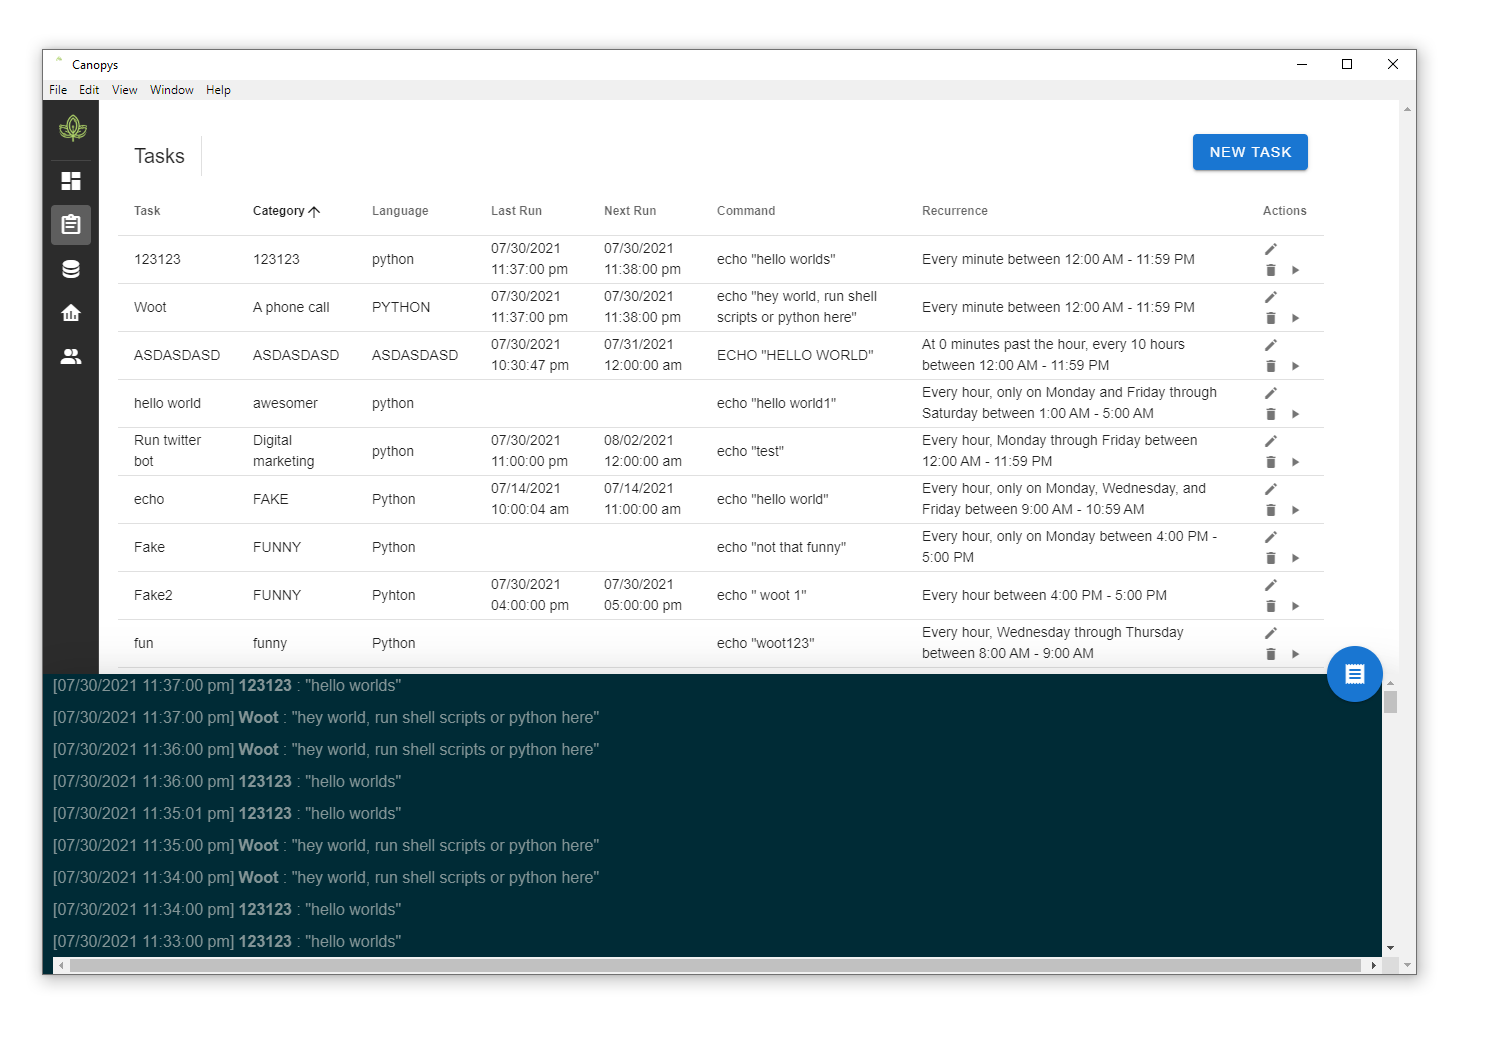
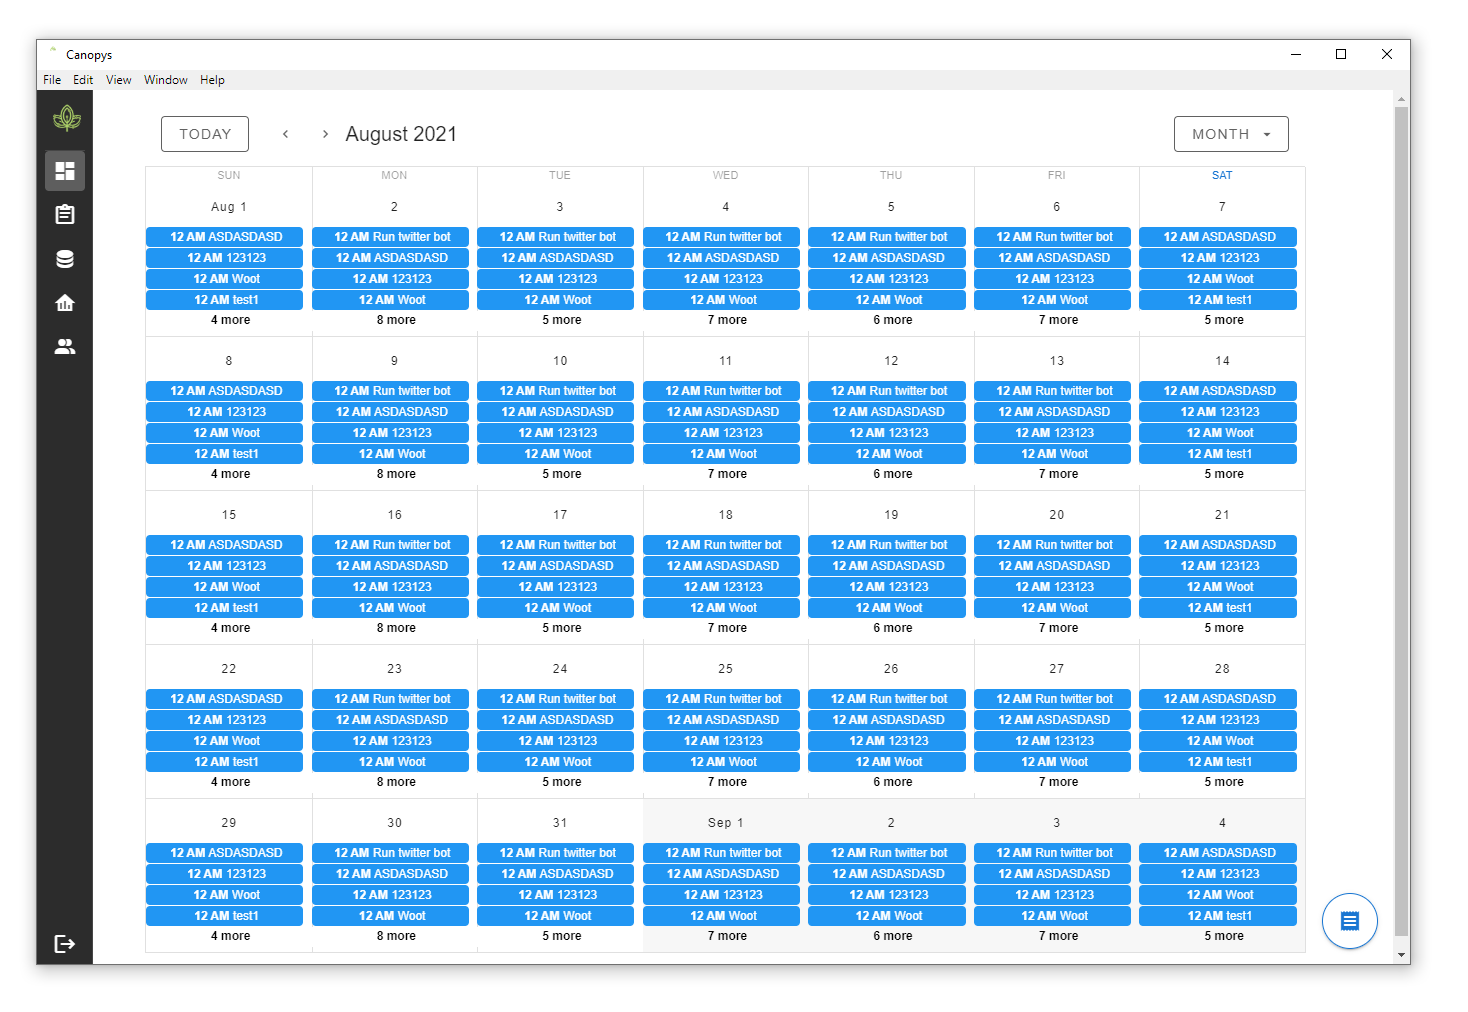
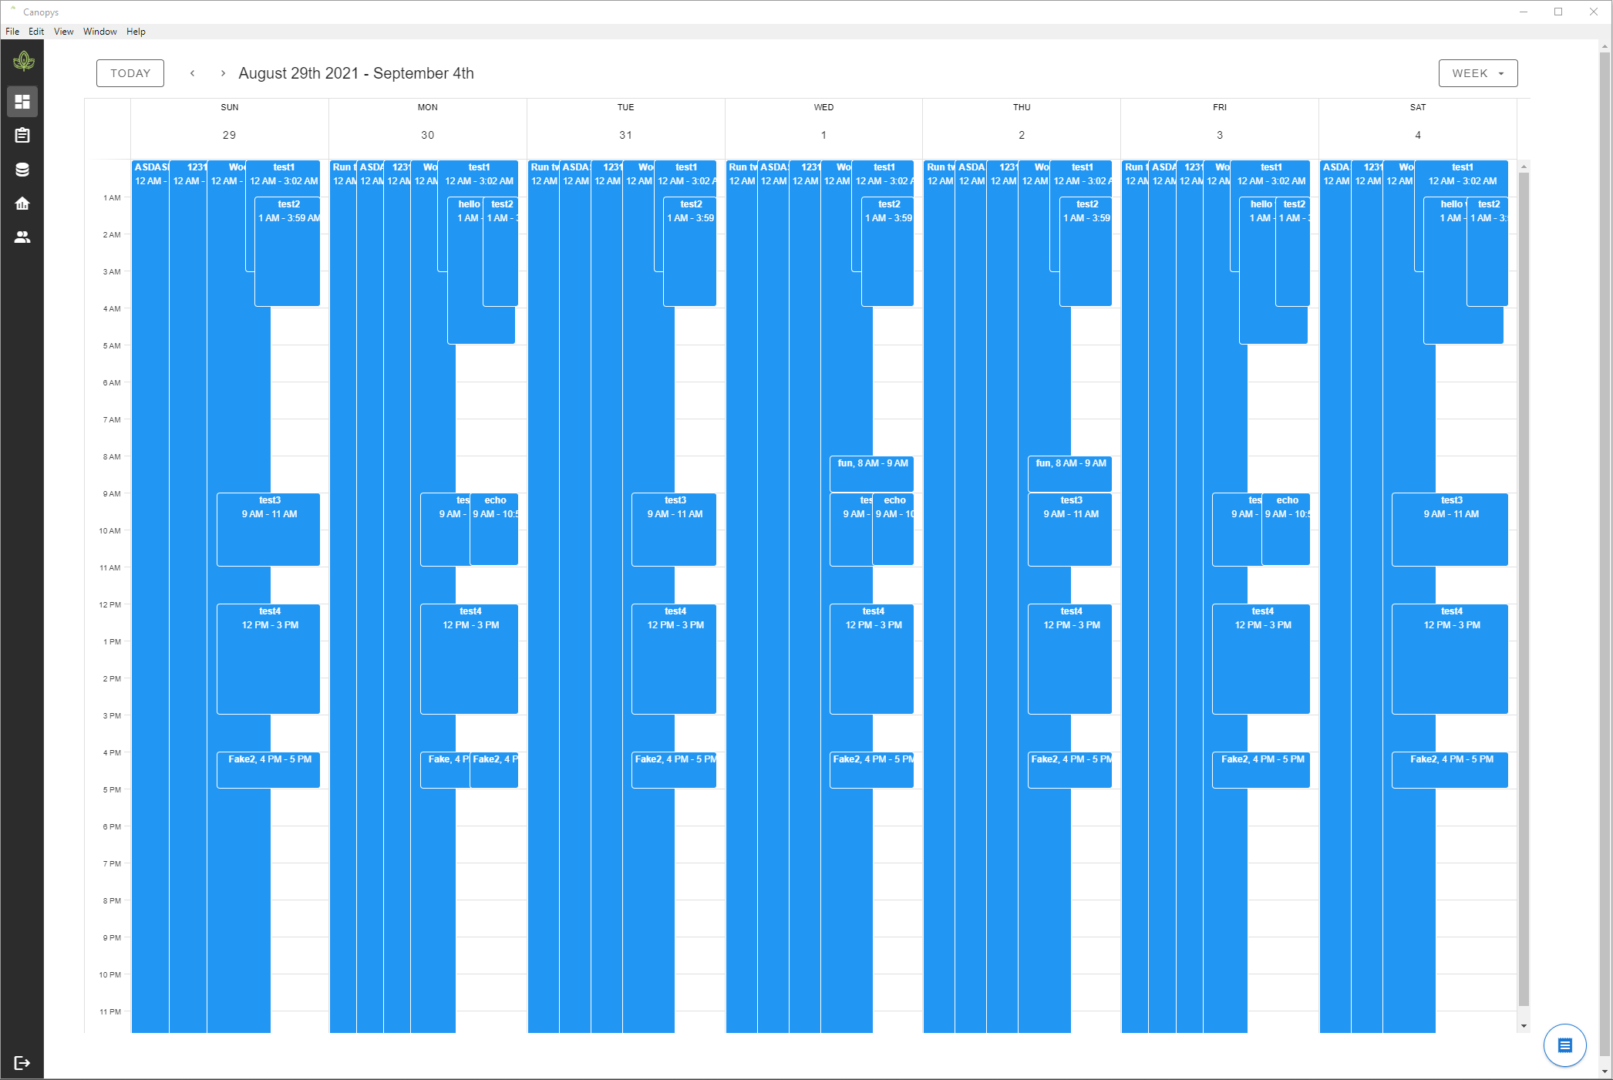
Before we release the next version, please test our Canopys 0.1.0 Task Scheduler and a Calendar view similar to Google Calendar. Let us know what you think!
I know what you’re thinking: this sure beats Windows Task Scheduler, and that’s one of the many reasons we built this solution. We wanted to offer a more straightforward workflow for generating a scheduled event.
Canopy Update v0.1.1 Details
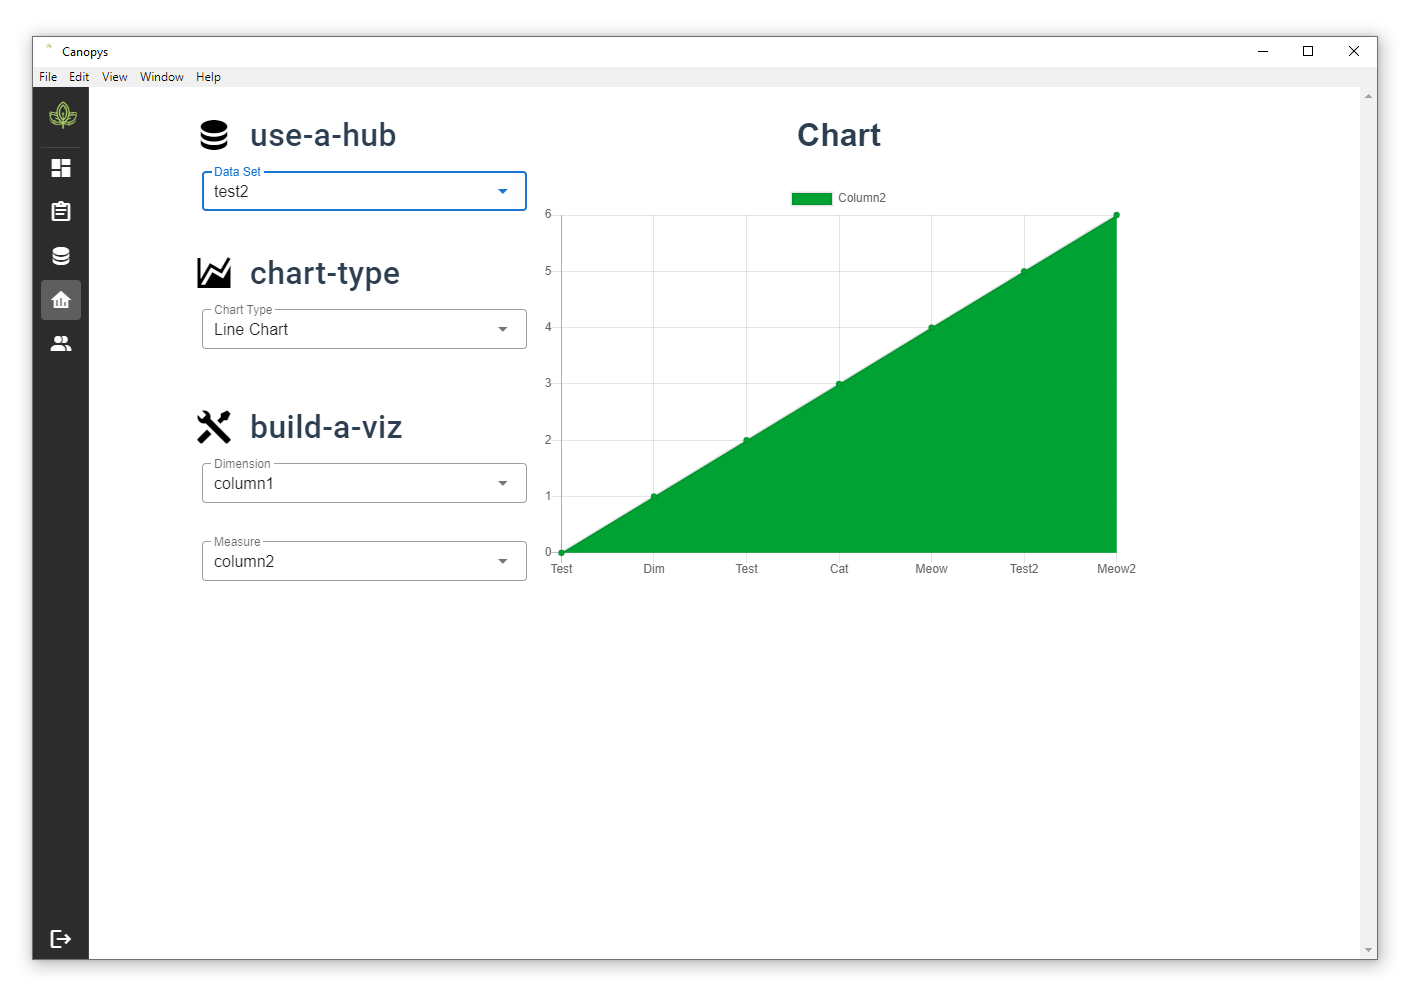
We are adding two major apps to Canopys: Data Hub and Data Viz. This means we now have a complete deployment solution. Task schedule, data storage, and analytics. All in one application.
Here’s a list of details we are adding.
Adding data hub
Adding data viz
Adding two charts, a line chart and a pie chart
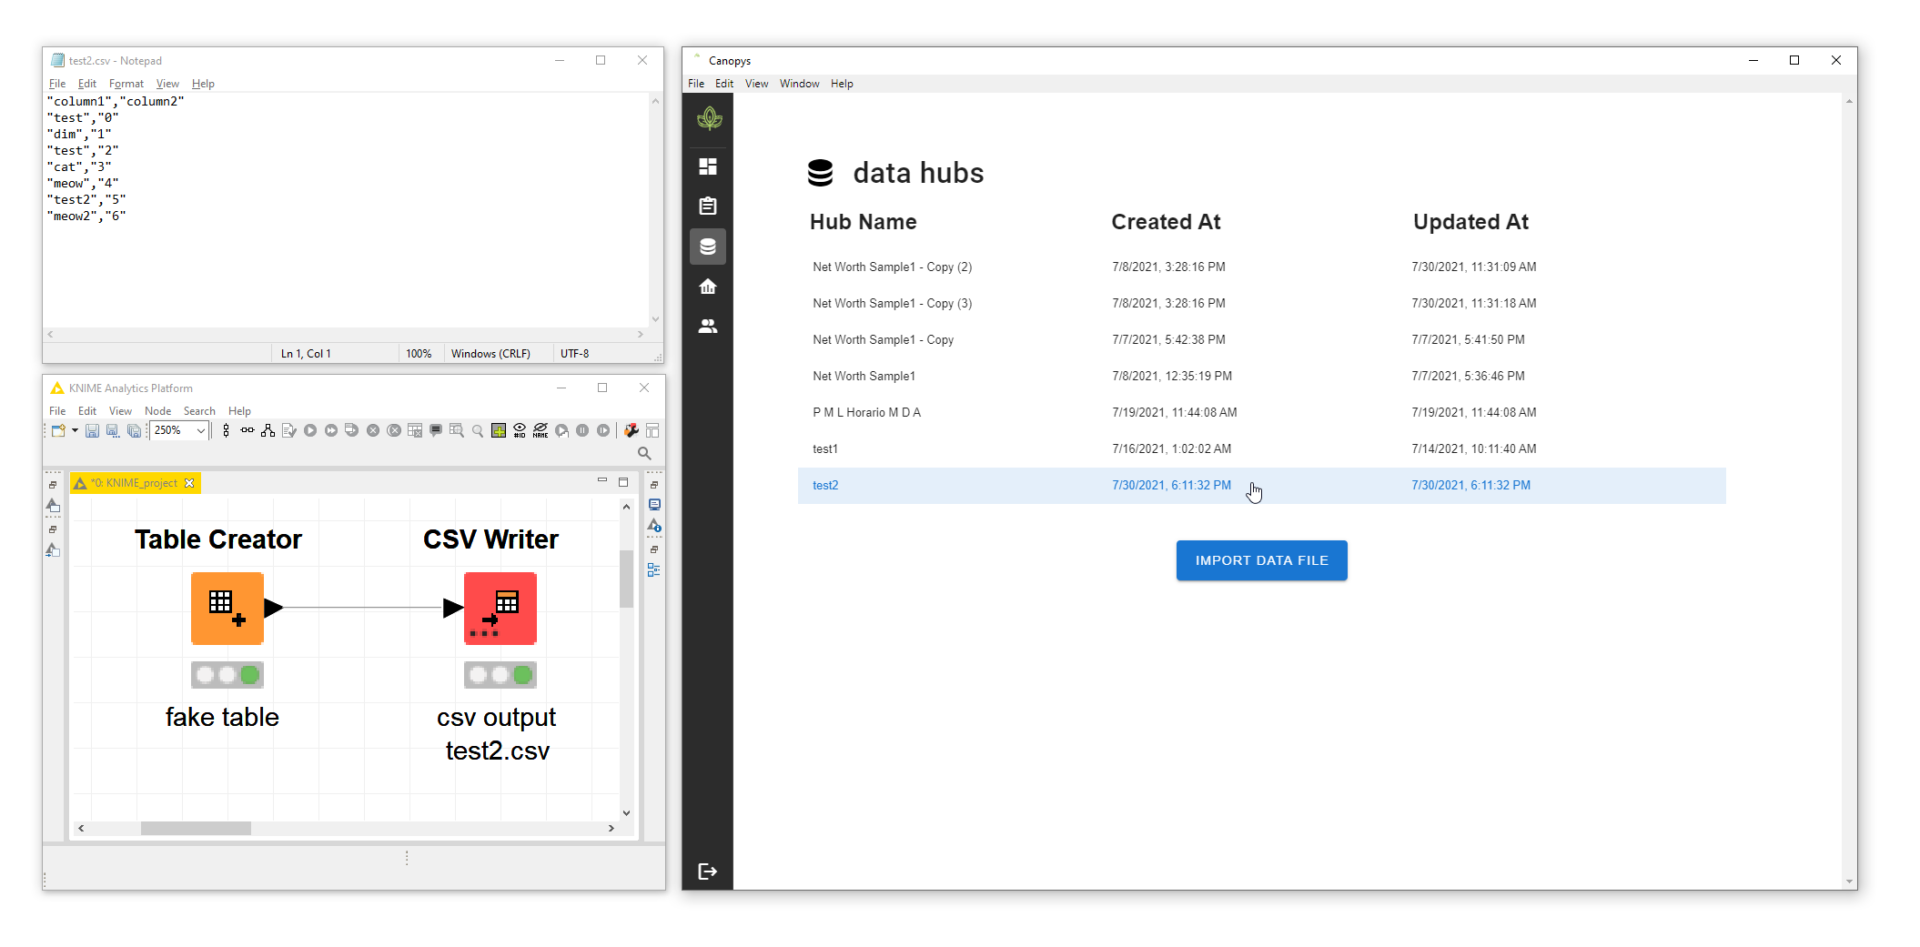
The data hub connects data to visualizations. Look how we offer data storage with one button. It accepts JSON and CSV files. We do not plan on increasing the data inputs because we do not want to be a data connector development company.
A demo of data hubs.
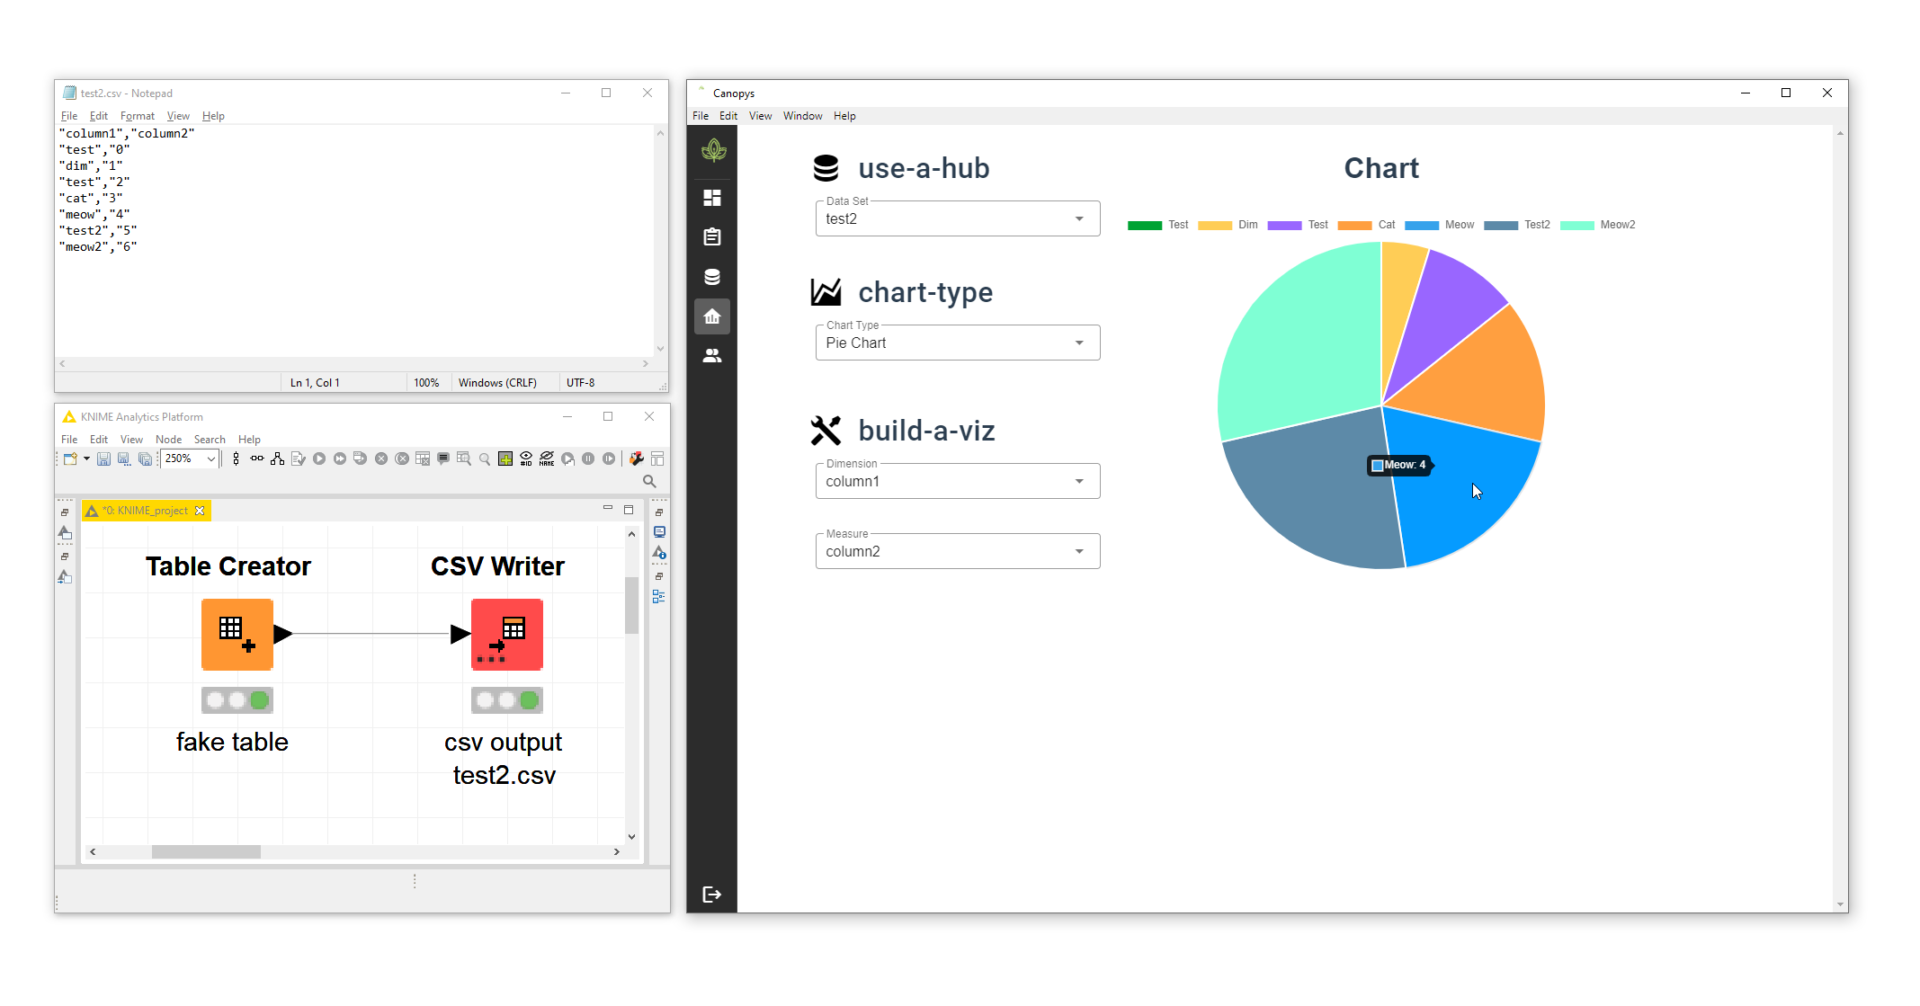
After the data is stored in Canopys, you can build charts immediately. Data hubs feed your analytics; everything is contained in this one application. Data Viz is where we are demoing the creation of a chart. In the future, this area will be different.
A demo of data viz, with a pie chart!Demo of a line chart.
Below, please find more about the future of Canopys and FAQ.
FAQ and Future Thoughts for Canopy
How will Canopys offer Collaboration? The ultimate objective with any analytics application is sharing it with someone else and embedding the chart in the web or app. We know our perspective on this ‘requirement’ will begin molding how people solve problems, allowing us to change how people solve problems.
What does the future hold? In the future, there will be a place to build multiple visualizations, and we are making a means of sharing these assets or data hubs with your teammates or clients.
Our team of engineers, my wife and I included, are all video game players, and we are building what we believe is a video game version of tech we have grown to love and adopt.
We aim to generate a user-friendly multiple-player video game in a realm of highly complex single-player video games. This video game does not require a certificate or engineering degree to be successful.
Are we adding more charts? Yes, that’s the plan. We are looking at KPI charts next. Once we have 4 or 5 visualizations or charts, we will be devoting all of our focus to the more prominent features we want to ensure we do correctly.
Welcome to an article about installing Anaconda distribution, a data science toolkit. The data science toolkit by Anaconda is a free solution available for your operating systems and great for anyone breaking into the data industry!
Anaconda Individual Edition will be the focus of this installation article, and we share information on both Mac and Windows below. This is the kind of app that helps you perform advanced techniques like Market Basket Analysis or maybe simple ETL. Begin here: beginners guide to ETL.
Before you begin, ask IT if it’s okay to install this on your device; if this is your device, enjoy installing Anaconda distribution for the first time! Use the table of contents to help you progress quickly.
A Brief History of Anaconda Distribution
Anaconda is a software distribution company founded in 2013 by Maxime Chevalier and Pieter Abbeel. The company’s flagship product is the Anaconda Python distribution, which includes various packages and libraries for data science, machine learning, scientific computing, and other fields.
Anaconda was created in response to a growing need for a streamlined and easy-to-use Python distribution that both beginners and experienced data scientists could use. The company’s founders saw the potential of Python as a powerful programming language for data analysis and scientific computing. Still, they recognized that many users were struggling with the complexities of setting up and managing their Python environments.
To address this challenge, Anaconda created a distribution that included the necessary packages and libraries for everyday data science tasks and tools for managing dependencies, creating virtual environments, and installing new packages. This made it easy for users to get started with Python and helped to popularize the language among the data science community.
Over time, Anaconda has continued to grow and expand its offerings. In addition to its flagship Python distribution, the company offers a range of other products and services, including training courses, consulting services, and enterprise support. Today, Anaconda is one of the largest and most active companies in data science and machine learning, with a growing user base and a solid commitment to innovation and excellence.
A Brief History of Anaconda Jupyter Notebook
We use Anaconda distribution for the app Jupyter Notebook! It’s easy to attain through the terminal. However, that’s one aspect of this distribution that’s nice to have!
Anaconda Jupyter Notebook is a popular data science and machine learning platform developed by Anaconda, a company founded in 2013.
Jupyter Notebook is an open-source web application that allows users to create, share, and view documents containing live code, equations, visualizations, and explanatory text. It was created by Wes McKinney in 2011 as a data analysis and visualization tool. Still, it quickly became popular among data scientists, individuals using AI vetting software, teams unlocking the power of data, and researchers who found it easy to use and collaborate.
In 2014, Anaconda acquired the rights to distribute Jupyter Notebook under its branding and began bundling it with its Python distribution, Anaconda3. This made it even easier for users to get started with Jupyter Notebook and helped to popularize it among the data science community.
Since then, Anaconda has continued to develop and improve the Jupyter Notebook, adding new features and integrations that make it even more powerful and versatile. Today, it is used by millions of users worldwide for a wide range of data analysis, machine learning, and scientific computing tasks.
Data science may appear complex!
Data science may appear complex because different variations of programming languages do the same thing.
Apps like Anaconda Distribution seek to lower the barriers.
There are millions of experts, many open-source packages, and unknown variables to make known, and these need to be implemented correctly. Installing Python, R, and other libraries the correct way each time begins to generate roadblocks to solving problems.
Anaconda seeks to make data science not complex! We are all about lowering barriers at Dev3lop and are eager to show you how to implement Anaconda, which has many great tools. Anaonda is the way to install, update, and run packages.
Build and train machine learning models using the best Python packages built by the open-source community, including scikit-learn, TensorFlow, and PyTorch.
Anaconda has over 25 million users worldwide; the open-source app is considered the easiest way to perform Python and R data science and machine learning, which can be completed on a single machine. Anaconda has opened the door for novice and pro data science gurus around the globe; where will this installation take you?
What will we cover in our anaconda3 setup article?
Downloading anaconda
Installing anaconda
Setup anaconda
Does Anaconda only work with Data Science?
Anaconda also works with other forms of data, like extracting, transforming, and even accessing Acid databases like PostgreSQL VS SQL Server. For example, data science isn’t required to use the Anaconda Jupyter Notebook.
Now that we made that clear let’s have fun.
Downloading Anaconda3 2021.05 (64bit) Setup
Like any application installation, we need to get the file on your computer to begin and determine the correct file that fits your operating system.
How do you download Anaconda on your local machine?
Navigate to anaconda.com and find the individual download. Like most open-source applications, they will do their best to make getting the application in your hands easy.
If you are behind a firewall and corporate IT has turned off this capability. How can I download Anaconda?
If your corporate IT settings do not allow you to download a Windows .exe executable file, download our zipped file as an alternative to changing the extension downloaded.
Installing Anaconda For the First Time
Installing Anaconda is going to be quick. Click the exe or dmg to begin the setup.
anaconda3 setup screen1, windows anaconda install
Ready, Mac installs Anaconda3 is about the same installation.
And Mac installer screenshotLastly, Mac installer for Anaconda offers a read-me
The license agreement is next; here are the basics.
Install and use the Anaconda Individual Edition (which was formerly known as Anaconda Distribution),
Modify and create derivative works of sample source code delivered in Anaconda Individual Edition from Anaconda’s repository and
Redistribute code files in source (if provided to you by Anaconda as source) and binary forms, with or without modification, subject to the requirements set forth below.
license agreement for anaconda3
Once you’re done reading this “License Agreement” novel, click I Agree, or you’ll start over!
The installation Type will be valid if you share the computer or need to generate a layer of admin privileges. Like most screens in an installer/setup, click next.
Choose just me, if it applies
You are choosing an install location. Here, we select the type of installation you would like to perform for anaconda3. Start by using the default install location today, and remember your destination folder.
Note: To properly install and set up Anaconda3, your computer will need 2.9 GB of available disc space.
Choosing a destination folder, use the default
We recommend default due to the lack of spacing presented in this directory.
In what folder should I install Anaconda on Windows?
We recommend installing Anaconda or Miniconda into a directory that contains only 7-bit ASCII characters and no spaces, such as C:anaconda. Do not install into paths that contain spaces such as C:Program Files or that include Unicode characters outside the 7-bit ASCII character set. This helps ensure correct operation and no errors when using any open-source tools in either Python 3 or Python 2 conda environments.
Advanced installation options. Here, we can customize how Anaconda integrates with our operating system. You can attempt to go non-recommend routes. However, I want to show you how to set up environment variables in a few minutes.
advanced options, avoid not recommended steps to save time
Setting up environment variables when installing anaconda3?
If you desire to change the environment variables, dive in; however, the documentation on the website suggests this is not the right move. We may update this area later as the training progresses.
Should I add Anaconda to the Windows PATH?
When installing Anaconda, we recommend that you do not add Anaconda to the Windows PATH because this can interfere with other software. Instead, open Anaconda with the Start Menu and select Anaconda Prompt, or use Anaconda Navigator (Start Menu – Anaconda Navigator).
Setting up environment variables when installing Anaconda might work for you, but based on the documentation on their website, we opt not to change our settings. However, enjoy if you’re a pro and understand what you’re doing with environment variables.
This is a great spot to remind ourselves that Anaconda is looking to set up its very own environment, and changing the way your computer handles incoming Python requests may negatively impact other applications your computers are dependent on using. So, using your environment variable settings should not be the next step. Anaconda3 is looking to build its environment to keep the problems off of your environment because things like this have destroyed computers for long enough. Anaconda3 is a workaround to needing to take this step.
Due diligence wins the race in life and when learning Python because anyone can write keyword-rich content about installing anaconda3.
Should I add Anaconda to the macOS or Linux PATH?
We do not recommend adding Anaconda to the PATH manually. During installation, you will be asked “Do you wish the installer to initialize Anaconda3 by running conda init?” We recommend “yes”. If you enter “no”, then conda will not modify your shell scripts at all. In order to initialize after the installation process is done, first run source /bin/activate and then run conda init.
I already have Python installed. Can I install Anaconda?
You do not need to uninstall other Python installations or packages before installing Anaconda. Even if you already have a system Python, another Python installation from a source such as the macOS Homebrew package manager and globally installed packages from pip such as pandas and NumPy, you do not need to uninstall, remove, or change any of them.
FAQ anaconda.com
Completing the anaconda3 installation setup
Congratulations, you are on your way to becoming a data science guru.
install of anaconda is completedmac install anaconda3 running packages scripts screenshotnext (however, Pycharm is excellent)finish
Click finish with both checkboxes and follow along to check out their tutorial. If you did not check the box and want to watch the tutorial, follow along here.
Mac install completed!
Start anaconda3 for the first time.
When installing, they throw in a lot of apps, too. In this tutorial, we aim to open Anaconda Navigator to begin the following tutorial.
How do I start anaconda3 on Windows?
Hit the Windows key.
type anaconda
open anaconda navigator
Skip anaconda Prompt, click navigator instead, and anaconda3 will open.
Open in the start menu.
If you’re on Mac, try SPACE+CMD and type anaconda or open your application folder and select Anaconda Navigator, one of the many things added to your machine.
The Anaconda application is now installed!MacOS icon in the application library
We show you How to do Tableau Server Automated Dashboard Image or Images using Tab admin. While offering Tableau Services, you’re bound to create a few tabcmd solutions!
While working at tableau.com, our founder started using PowerShell to bulk automate dashboard content and focused on iterating things from tabcmd due to its simplicity.
You can begin using spreadsheets and the Tableau repo as a data source. This is easy to change into something more robust as you simultaneously scale this tableau server automation solution across your sites, projects, or everything.
Tableau provides the tabcmd command-line utility, which you can use to automate site administration tasks on your Tableau Server site—for example, creating or deleting users, projects, and groups.
Note: The tabcmd utility is included with the Tableau Server. However, its installer is not included. Download the installer from the Tableau website if you want to run it on a computer other than the initial server node. For more information, see Install tabcmd.
Thanks for visiting our Tableau Server Image Automation blog.
There are many ways to solve this workload; this is one version of the solution, likely legacy since recent updates. We will find out as the application grows; there are no complaints yet.
This chunk of code is “user-friendly” enough for non-technical experts to automate images off the Tableau server. We start by explaining this and how it works and leave comments in the code.
Tableau Server automation is helpful.
Are you ready to automate pulling PNG from the Tableau Server? This is your helpful guide.
It’s possible to use it to maintain an automated process… Which means hands-free automation.
It’s a 100% successful script to automate content since 2015.
Don’t stress out your hands; manual clicking is not a strategy.
Keep your hands and arms relaxed. The code will help you automate the process using the Tableau Servers repo.
It’s enjoyable to pick up a new language if you have the time or like new puzzles; we will use PowerShell.
Automate Dashboard Image or PNG Export Script
Please Note that the hashtag is a comment in PowerShell, and the script will not see this. You paste the code to win.
The code is pasted into a .txt and saved as a .ps1. Save and close after you add your edits and environment variables.
We can’t offer you a .ps1 file because that would not work as a download; .ps1 files can have funky stuff, so be advised. However, this has been seen by thousands and used hundreds of times daily by 30+ clients. Ping
Update: I will come and upgrade the code to explain each segment.
We hope this helps you overcome the hard request! Scraping images or whatever you need for automated Tableau server content can be accomplished with this code below. Have fun!
#Comment – Read Comments, Edit Variables, Run it!
.#_______________________________Start here # PNG EXPORT Script # A PowerShell script to pull down pngs of Tableau “views” # # Created By – Tyler Garrett # Email – tyler@dev3lop.com # Version 1 # # # || NOTES || # Create Directory C:\POSH\PNGExport # This directory will store all content # Script expects Tableau Bin directory to be set in Environment Variable Path #_______________________________
#________________________________ # Set variables #________________________________ $TS = “http://localhost” #Server $username = “admin” #tableau server account $pass = “admin” #tableau server password $pgUSR = “readonly” #readonly account password must be setup beforehand $pgPW = “admin” #postgres password $SiteF = “BeepTest” #site you’re pulling PNGs from $ProjectF = “ProjectTest” #project you’re pulling PNGs from #_______________________________ cd C:\POSH\PNGExport #_______________________________ #————–=====================]]]]]]]]]]]]]]]]]]]]]]]]]]]]]] #¦¦¦¦¦¦¦¦¦¦¦¦¦¦¦¦¦¦¦¦¦¦¦¦¦¦¦¦¦¦¦¦¦¦¦¦¦¦¦¦¦¦¦¦¦¦¦¦¦¦¦¦¦¦¦¦¦¦¦¦¦ # | # Query postgresql and build CSV with workbook URL (3 steps)| # | #¦¦¦¦¦¦¦¦¦¦¦¦¦¦¦¦¦¦¦¦¦¦¦¦¦¦¦¦¦¦¦¦¦¦¦¦¦¦¦¦¦¦¦¦¦¦¦¦¦¦¦¦¦¦¦¦¦¦¦¦¦ # | # 1.Connection info | # | #¦¦¦¦¦¦¦¦¦¦¦¦¦¦¦¦¦¦¦¦¦¦¦¦¦¦¦¦¦¦¦¦¦¦¦¦¦¦¦¦¦¦¦¦¦¦¦¦¦¦¦¦¦¦¦¦¦
#Commented – Open connection to database to query repo
#Commented Utilize Driver and funnel query to repo through.
$connectionString = ‘Driver={PostgreSQL ANSI(x64)};Server=localhost; Port=8060; Database=workgroup; Uid=’+$pgUSR+’; Pwd=’+$pgPW+’;’ $query = @” SELECT v.view_url FROM _views v INNER JOIN _workbooks w on (w.id=v.workbook_id) INNER JOIN _sites s on (s.id = v.site_id) WHERE s.name = ‘$SiteF’ and w.project_name = ‘$ProjectF’ “@ #¦¦¦¦¦¦¦¦¦¦¦¦¦¦¦¦¦¦¦¦¦¦¦¦¦¦¦¦¦¦¦¦¦¦¦¦¦¦¦¦¦¦¦¦¦¦¦¦¦¦¦¦¦¦¦¦¦¦¦¦¦ # | Don’t change anything in the syntax around the query above, I tried and it broke. # 3.Build CSV to be used for tabcmd from the above query| # | #¦¦¦¦¦¦¦¦¦¦¦¦¦¦¦¦¦¦¦¦¦¦¦¦¦¦¦¦¦¦¦¦¦¦¦¦¦¦¦¦¦¦¦¦¦¦¦¦¦¦¦¦¦¦¦¦¦ Get-Stuff -connectionString $connectionString -query $query | ` Select-Object -Skip 1 -Property view_url | ` Export-Csv -Path “C:\POSH\PNGExport\Reports.csv” -NoTypeInformation -Delimiter “;” #————–=====================]]]]]]]]]]]]]]]]]]]]]]]]]]]]]] #_________________________________ # Loop through CSV from above and export those views as PNG files # -replace is used in the loop to save the file name with out a “/” # because this value isn’t allowed in a file naming convention # error output will be generated in the folder #_________________________________
#Comment Loops in Powershell to export PNGs
#Comment: pay attention to this looping process; you can tabcmd your way through anything.
#NOTE: Change Paths
tabcmd login -s $TS -u $username -p $pass -t $SiteF ForEach ($wb in @(Import-Csv -Path C:\POSH\PNGExport\Reports.csv | select -expand view_url) ) { Try { $newwb = $wb -replace “/”, “_” tabcmd export $wb –png -f $newwb 2>> C:\POSH\PNGExport\TabCmdGetWbErr.txt } Catch { Write-Error -Message “Error occurred: $_” } } #_________________________________ # Convert PNG to BMP – helps people who are moving these photos into Powerpoint # Comment the Dir *.png…. line out of the script if you want to keep them as PNG files #_________________________________ Dir *.png | rename-item -newname { $_.name -replace ‘\.png$’,’.bmp’ } tabcmd logout #_______________________________End here
End of your Tableau Server Automated Dashboard Image Script
As we said, Tableau server automated dashboard images are straightforward with the correct code & explained in detail!