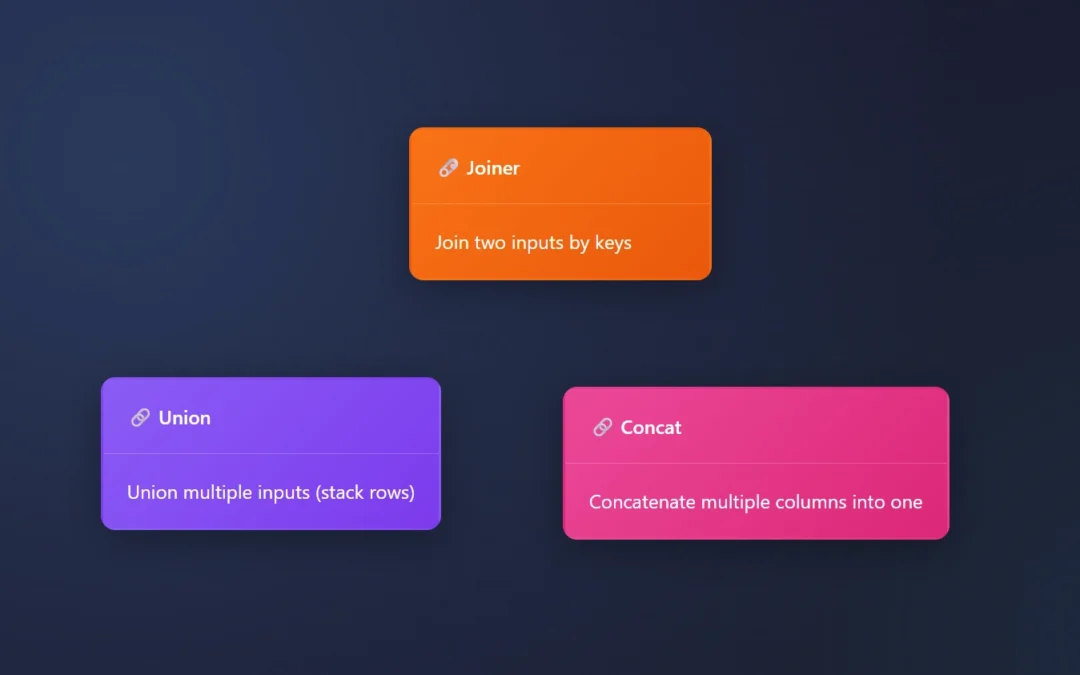
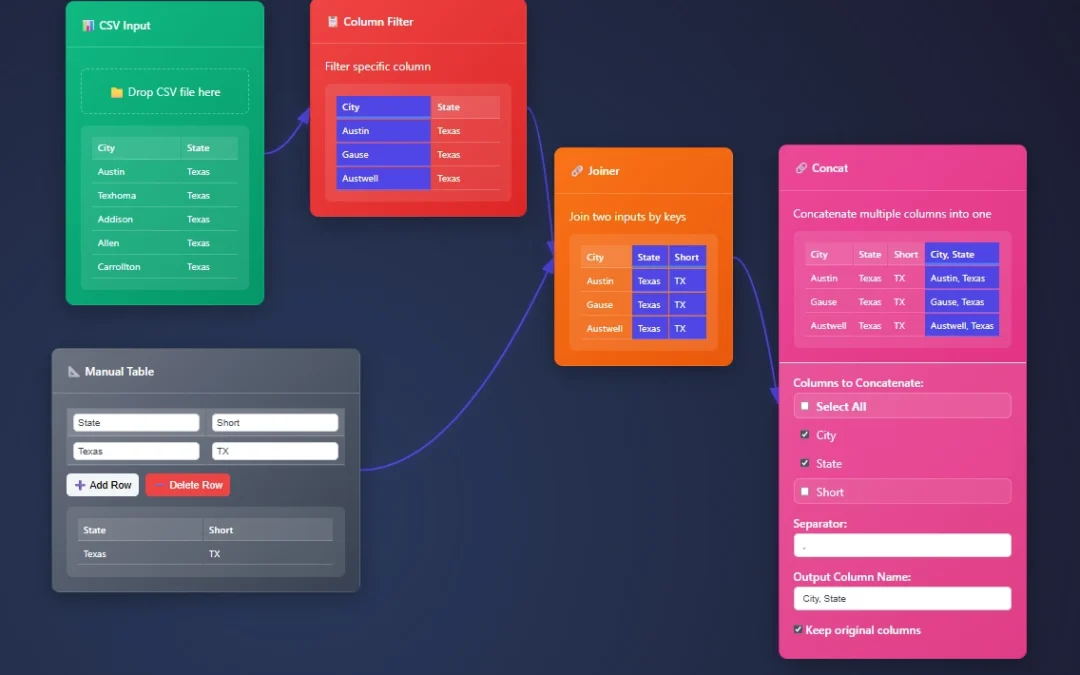
Concat merges everything, and it doesn’t care about data types.
What it does: Merges text from different columns
Add a custom string between what you’re merging.
Perfect for:
Creating full names from first/last
Building addresses from components
Generating unique IDs or labels
Bringing together: State with City in 1 column.
Real-World Examples
Join:
Match customer emails with their support tickets
Combine product IDs with inventory details
Union:
Merge Q1, Q2, Q3 sales into one report
Combine survey responses from different regions
Concat:
Create “Last, First” name formats
Build URLs from domain + path components
Pro Tips
Joins work best with unique identifiers
Union requires matching column structures
Concat can add custom separators (spaces, dashes, etc.)
Remove duplicate records
No more copy-pasting between spreadsheets or writing complex formulas – just connect the dots and let the data flow! No strange joining tools in Excel, no learning the difference between joins, and just get your data wrangled already!
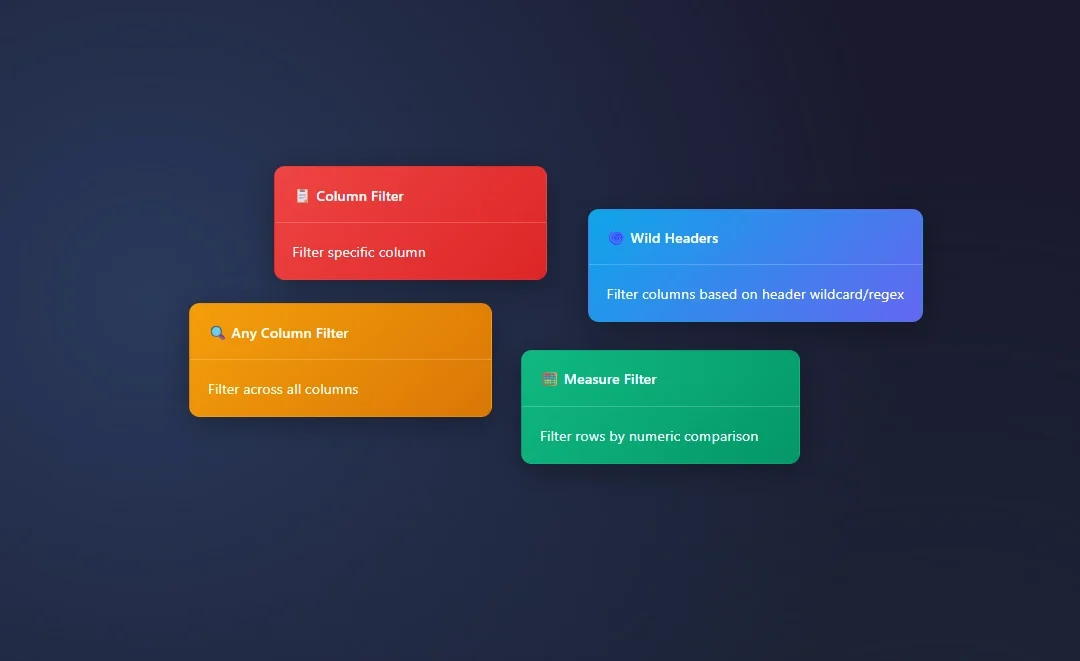
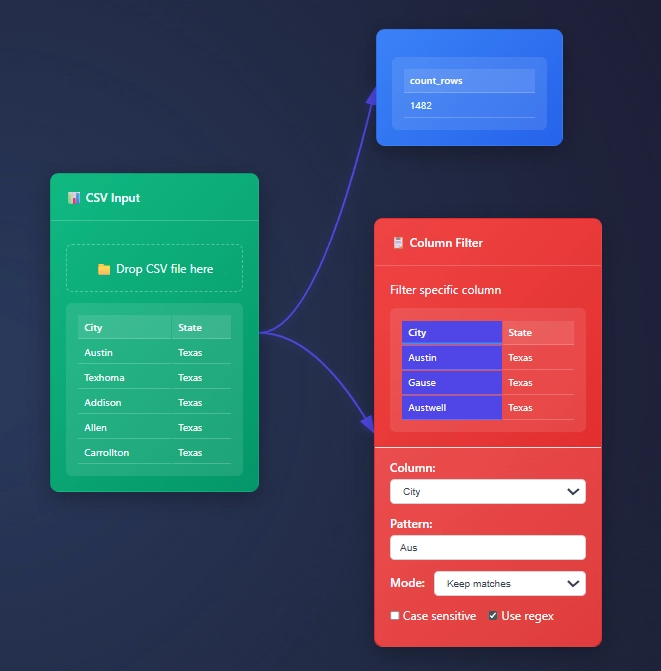
The filtering nodes help you reduce the number of rows, drill into the exact information needed, and create a data set that will add value VS confuse your audience.
When filtering, remember you’re reducing the amount of data coming through the node, or you can swap to include.
Include, exclude, and ultimately work on your data.
Column filter is nice, but at times wild headers are king
Why This Beats Spreadsheet Hell
Visual Feedback: See filtered results instantly
Non-Destructive: Your original data stays safe
Never recycle: You filter data unnecessarily.
Stackable: Chain multiple filters for complex queries
Reversible: Remove or modify filters anytime
Filtering Pro Tips
Be willing to test filters, and create branches. Then right click the beginning of the branch to duplicate the entire downstream operation. This then lets you edit filters across multiple streams of data, and see the difference between your filtering!
Start with “Any Column” to explore strings, measure filter to explore measures, then switch to specific column filters as you understand your data better, and wild headers for those edge cases where you have a lot of columns (but only a couple matter).
ET1 is built to easily filter (transform) your data. Remember, it’s like having a conversation with your dataset!
ET1 helps you extract, transform, and load data in a single user-friendly canvas.
Data automation in a single canvas.
Each node is simple and easy to use in VR/AR headsets.
Welcome to basic training, where we show you the basics so that you’re dangerous. Don’t worry the engine under-the-hood keeps you safe!
If you’re familiar with music equipment, own a phone, or maybe a computer, you’re more than likely familiar with inputs and outputs with audio.
Your phone has a microphone. That’s an input.
Your phone has a speaker. That’s an output.
How those things work, pure magic, but it works and so should your data automation.
ET1 uses outputs, inputs, and a mixture of nodes to help people solve data problems.
Never loop or recycle data (audio analogy)
The DAG Streaming engine also means no ability to loop data/music infinitely, which means you never hurt your ears or your machine!
ET1 is a lot like an audio device and nodes help you change the audio.
Data flows through ET1 through, from output to input.
Nodes
Nodes are built to be an easy way to visually solve problems, and not become overwhelming.
ET1 is a lot like a guitar pedal, not overwhelming, limited options, should be able to figure it out by playing with tool.
-tyler garrett
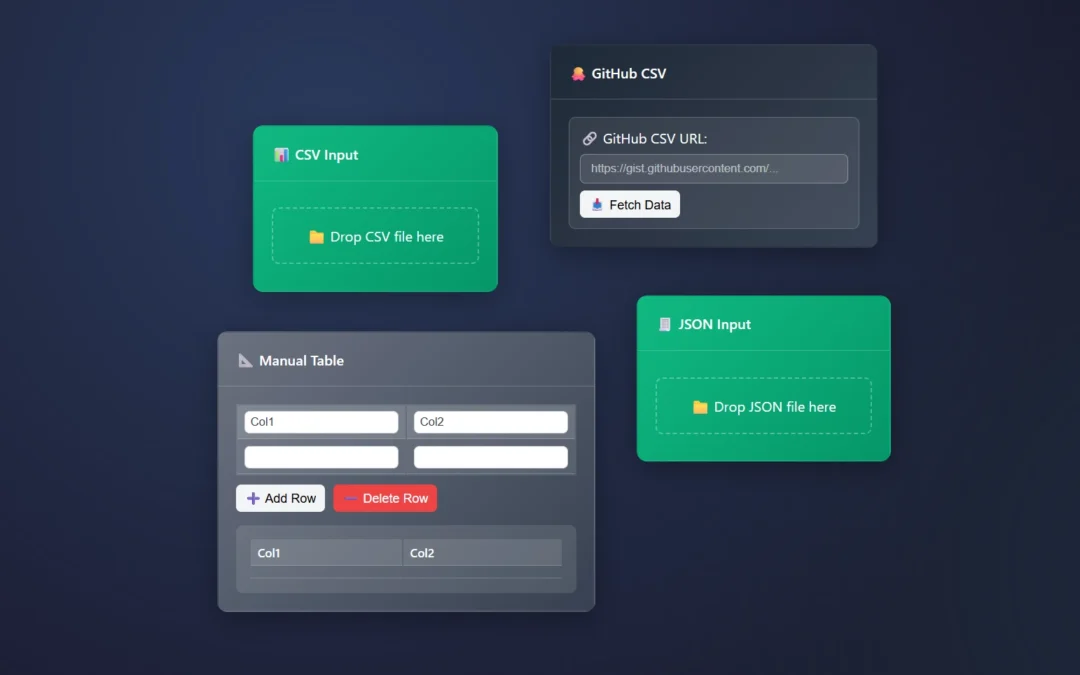
🚀 Getting Started
Drag a data source node (CSV, JSON, or Manual Table)
Click the node to configure it
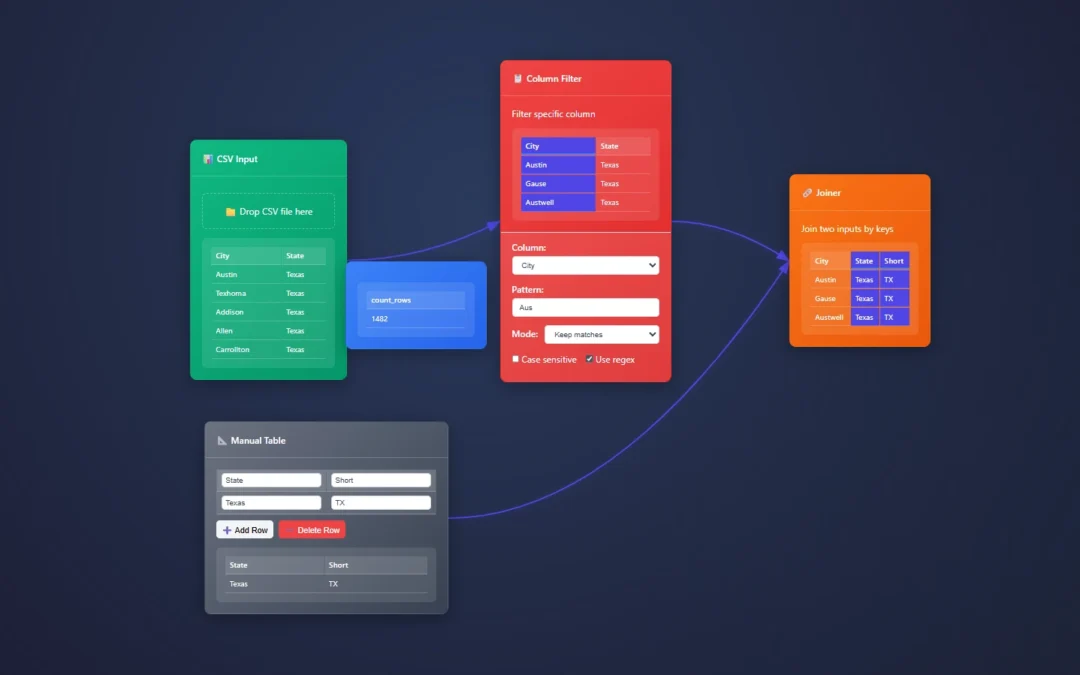
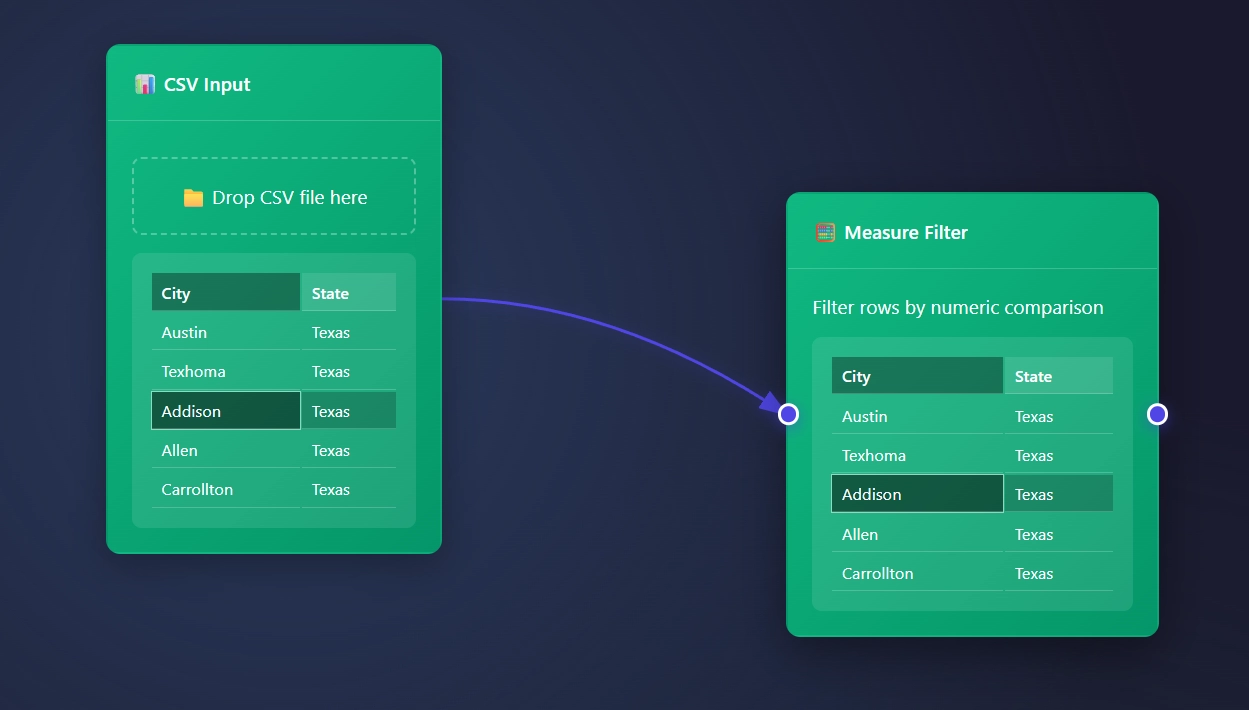
Connect nodes by dragging from output to input circles
Drag to output connect/create
🔍 Core Concepts
Nodes: Each node, tool, or box does one or more things to your data
Connections: Arrows show how data flows. From Output to input
Think of it like audio equipment, that is always ready
Preview: See results instantly under each node
Audio is always on, instantly able to preview
Cell level highlights..!
Hover your mouse over cells to see and understand your data automation tools better.
Highlight a cell, see it highlight across nodes, branches and the canvas.
How to start ET1.
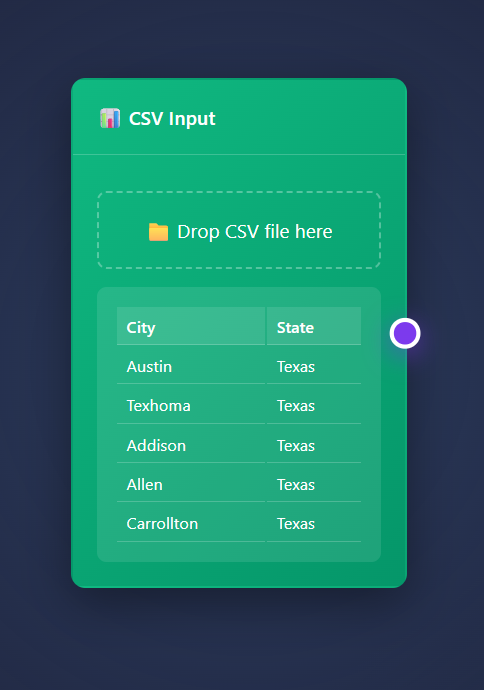
ET1 starts with a CSV Input Node open and available to begin slicing your data.
Csv file looks like file.csv and opens in ET1.
CSV data usually looks like…
City, State
Austin, Texas
Texhoma, Texas
Addison, Texas
Allen, Texas
Carrollton, Texas
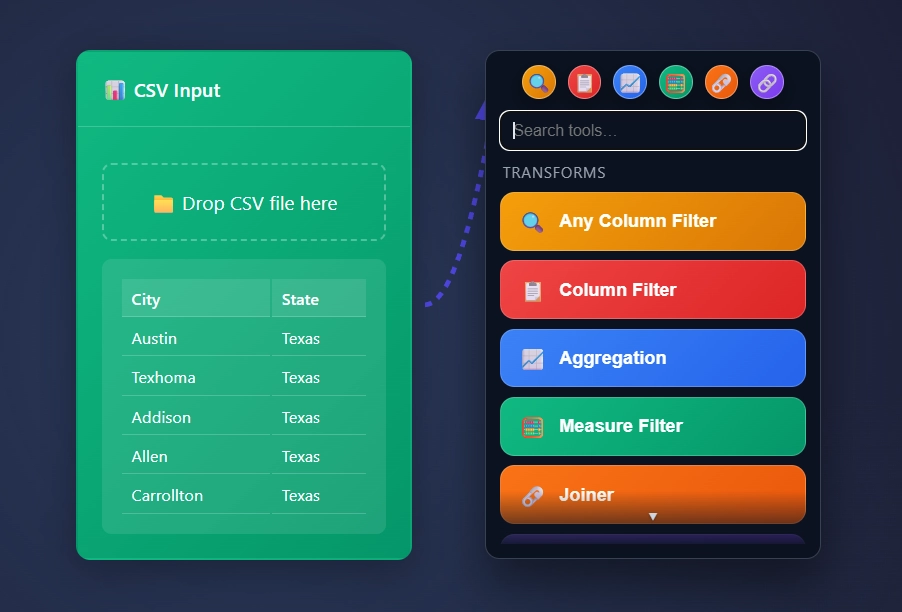
Connecting the dots, creating connectors, drawing connections, the node menu
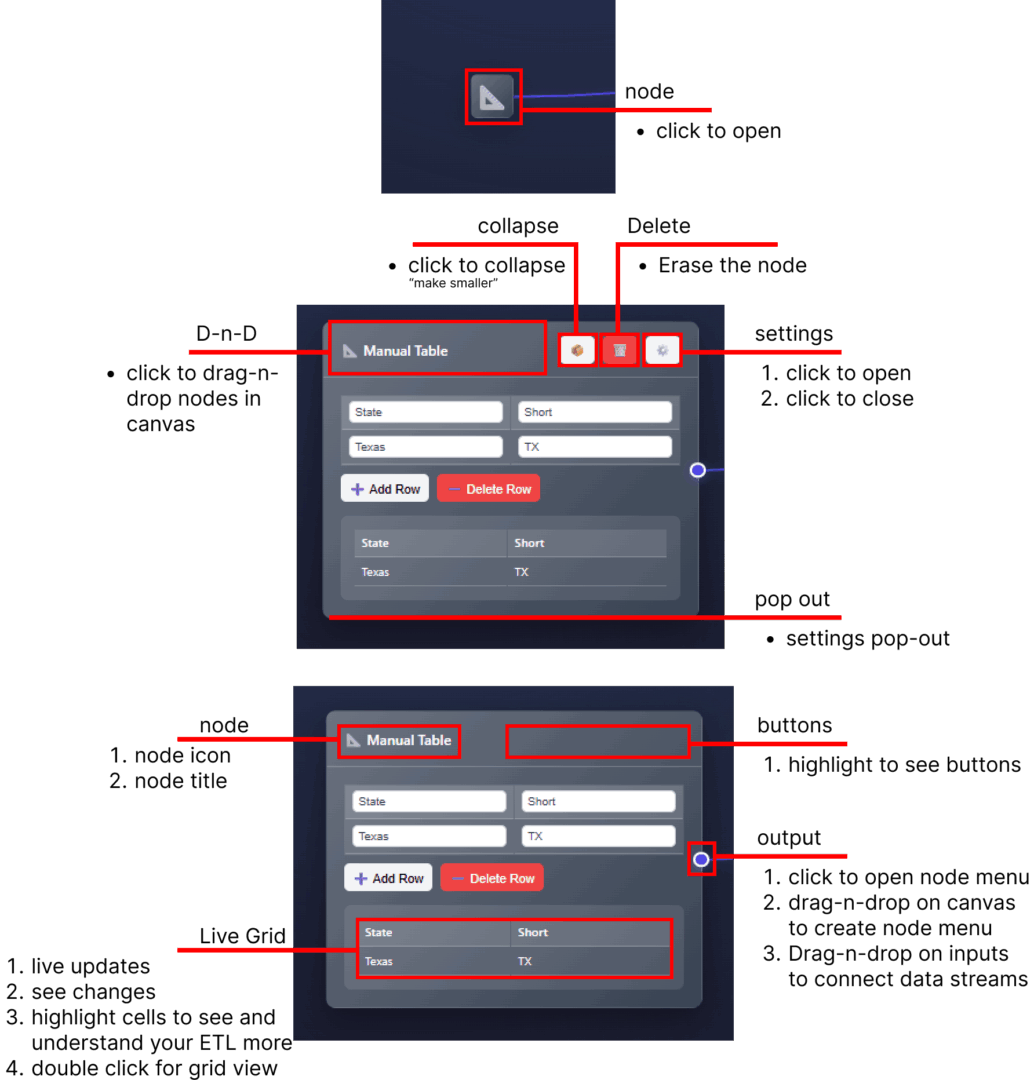
When highlighting on the right of a node with an output, you will find a circle.
This creates an arrow that can connect to the input of other nodes.
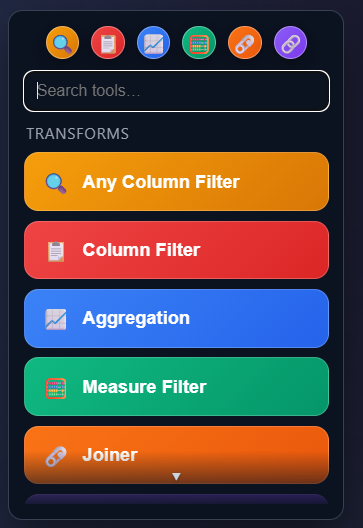
Node Quick Menu
Clicking the circle creates an arrow that points at a scrollable node menu, and automatically places the node directly to the right of your node.
The Quick Menu!
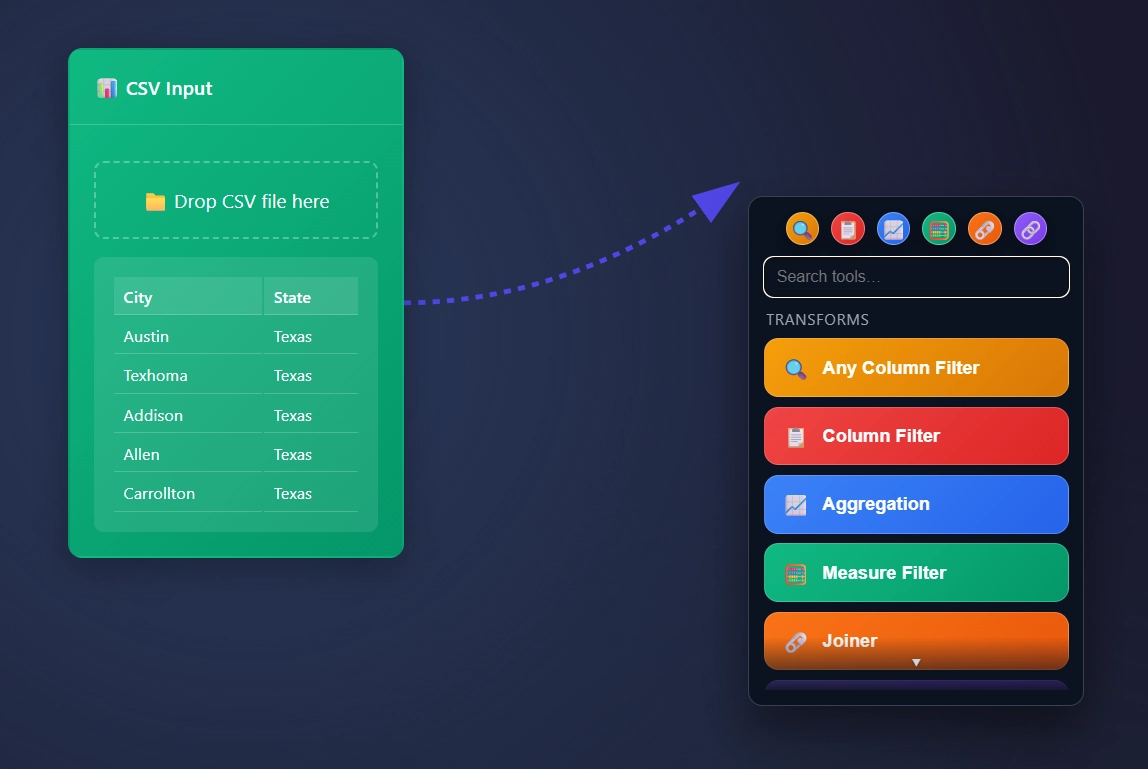
“Drag” the circle by clicking and dragging your mouse to create an arrow…
“Drop” the arrow by letting go of your mouse click into a blank canvas to create a scrollable node menu where you need a node to be placed.
Drag the circle and drop.. not that crazy right!
Save your favorite nodes in the 6 circles in the top. Drag and drop the node/tool into the circle to save your favorite nodes, to make for an easier development lifecycle.
It is undeniable that data can be overwhelming, and those who work with it daily are adept at navigating this complexity. ET1 is designed to assist individuals in managing this chaos, eliminating the constraints associated with outdated software that is over 20 years old.
ET1 is an easy-to-use tool. The intention is to create an ETL solution that empowers everyone to participate and isn’t intimidating.
Many ETL solutions are complex, not refined, and lack non-technical adoption.
Many ETL solutions involve lengthy installations, fruitless online searches, and community forums overrun with “partners” seeking clients and SEO backlinks. Often, drivers fail, and each year, companies face lengthy setups just to access features that 99% of competitors already offer…
Then, your company must rely on this dated technology, with a data processing engine that’s 20 years old, to gain a competitive edge in 2025. They implement server changes but only modify the front-end, while the poorly built back-end remains. As a result, the front-end server suffers due to the shift from desktop to web-based viewership.
Most ETL software prioritize the database community, which consequently hinders overall solution efficiency. Databases primarily focus on columns, data types, and tables, relegating row-level or cell-level data to a position of secondary importance. With our DAG engine, we’re able to treat each row as an important and essential asset to the data solution.
ET1 facilitates repeatable data cleaning within an intuitive environment. It serves as a visual data workbench, empowering users to explore, cleanse, and articulate data solutions more efficiently than costly “legacy solutions.”
Think of ET1 as a way to easily streamline data management in a user-friendly no-code environment that doesn’t require walls to climb. –Tyler
The vision
With 13 years of experience in drag-and-drop data engineering, data lakes, data warehouses, and dashboards, I have developed ET1 for users of all backgrounds. My intention is for ET1 to be intuitive and user-friendly, evoking the feeling of playing with guitar pedals to create music, rather than a complex, “engineer-only” interface that overwhelms even experienced users. I recognize that not everyone associates data cleaning with the ETL process – extract, transform, load – and I aim to make ET1 accessible and understandable for those unfamiliar with ETL terminology.
To illustrate, envision ET1 as a music platform facilitating the flow of data through inputs and outputs. Each node within ET1 functions similarly to a guitar pedal, each with its own inputs and outputs. These “pedals” are designed to be compact, require minimal configuration, and offer a streamlined, intuitive user experience.
What is ETL? Extract, Transform, Load.
Extract, Pull the data.
Transform, Unique Filter, Sort, Join Node, Merge, Update, and essentially change the information.
Load, Send the data to a file, database, chart, report, or dashboard.
The Install, Setup, Operating Systems, Requirements?
No install and no setup and any operating system will work.
Unlike all ETL applications, ET1 opens instantly. There are no drivers. Lastly, no interesting implementation.
Do you have a web browser? How else did you get here. That’s the minimum requirement.
Also… With ET1 you can…
Start cleaning and filtering data before KNIME loads.
Begin your ETL journey before you understand the pricing of Alteryx.
Core Functionality
The core functionality of ET1 will change and mutate over a period of time.
Data Transformation: Various transformation nodes (filters, joins, aggregations, etc.)
Data Output: Export to CSV, JSON, and Excel formats
What’s exciting is it’s easy for us to add new features because we are not a large platform!
ET1 Key Features
Here are a few features about ET1 that make the app exciting.
Node-Based Interface:
Drag-and-drop nodes for different operations
Visual connections between nodes
Real-time data previews, flow data downstream
Node Types:
Input: CSV, JSON, GitHub, Manual Table
Transform: Filter, Join, Union, Pivot, Sort, etc.
Output: CSV, JSON, Excel
Advanced Features:
Branching and versioning of data flows
Node settings and configuration
Collapsible nodes for better organization
Context menus for node operations
Data Processing:
Column operations (rename, filter, normalize)
String operations (concatenation, splitting)
Aggregations and calculations
Data types aren’t very interesting to solve
Data types are for databases
ET1 is not a database, it’s JavaScript
Data is stored in graphs
Data types are boring
UI/UX:
Responsive design, everything just flows downstream
Interactive previews, makes it easy to see what changed
Not scary, eager to avoid the developer style tools
Highlight cells per data grid to visually inspect across canvas
Technical Specs
This application is not mobile friendly, mobility will not be a major focus, with that said, this will requires a computer.
There are no specific computer requirements needed, any machine should work, thanks for giving this an attempt.
The software requires no installation, and no setup.
We currently do not store any information about users, or your data. When we decide to add authorization, we will more than likely use Auth0, we are familiar with Auth0 due to our development with Canopys.
Thank you for learning about ET1.
Jump back to the ET1 Overview to continue learning about how ET1 will help your team save time and money when removing the chaos from your data.


