ET1 helps you extract, transform, and load data in a single user-friendly canvas.
Data automation in a single canvas.
Each node is simple and easy to use in VR/AR headsets.
Welcome to basic training, where we show you the basics so that you’re dangerous. Don’t worry the engine under-the-hood keeps you safe!
If you’re familiar with music equipment, own a phone, or maybe a computer, you’re more than likely familiar with inputs and outputs with audio.
Your phone has a microphone. That’s an input.
Your phone has a speaker. That’s an output.
How those things work, pure magic, but it works and so should your data automation.
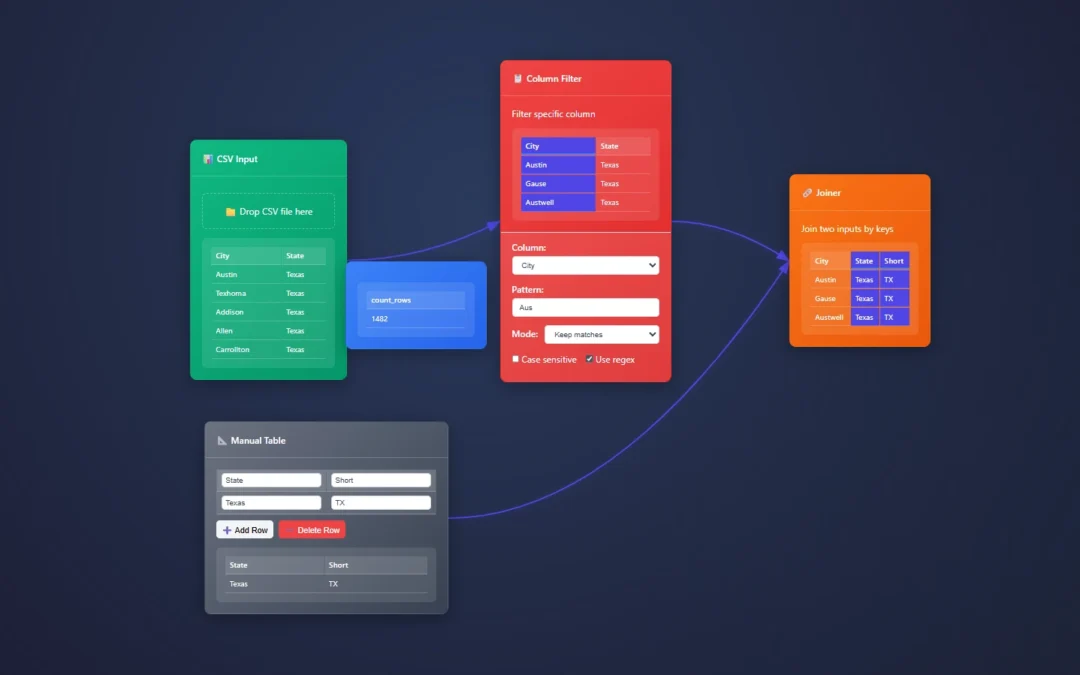
ET1 uses outputs, inputs, and a mixture of nodes to help people solve data problems.
Never loop or recycle data (audio analogy)
The DAG Streaming engine also means no ability to loop data/music infinitely, which means you never hurt your ears or your machine!
ET1 is a lot like an audio device and nodes help you change the audio.
Data flows through ET1 through, from output to input.
Nodes
Nodes are built to be an easy way to visually solve problems, and not become overwhelming.
ET1 is a lot like a guitar pedal, not overwhelming, limited options, should be able to figure it out by playing with tool.
-tyler garrett
🚀 Getting Started
- Drag a data source node (CSV, JSON, or Manual Table)
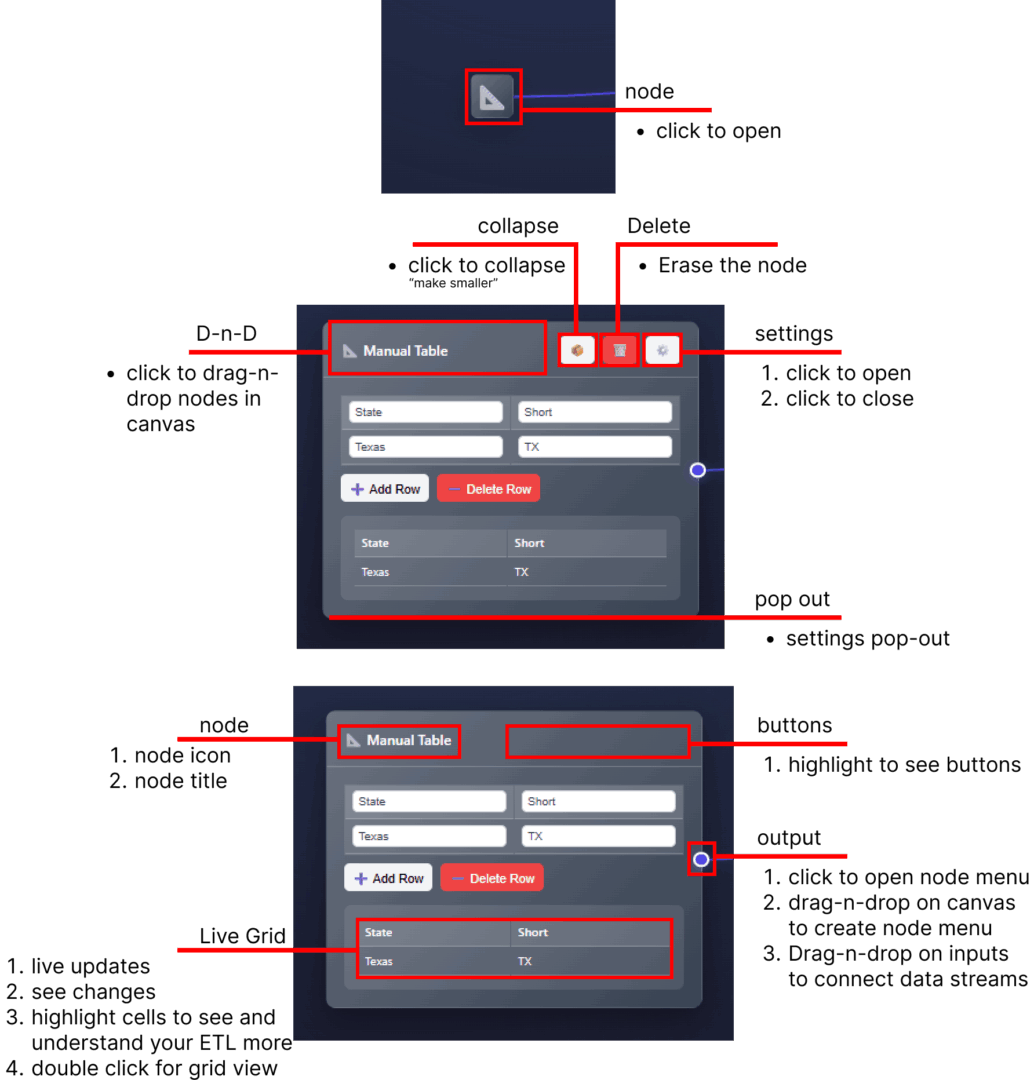
- Click the node to configure it
- Connect nodes by dragging from output to input circles
- Drag to output connect/create
🔍 Core Concepts
- Nodes: Each node, tool, or box does one or more things to your data
- Connections: Arrows show how data flows. From Output to input
- Think of it like audio equipment, that is always ready
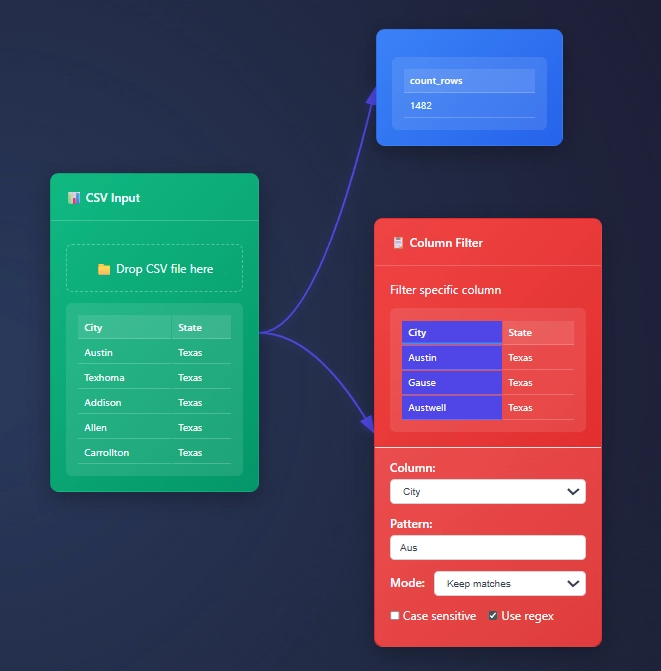
- Preview: See results instantly under each node
- Audio is always on, instantly able to preview
Cell level highlights..!
Hover your mouse over cells to see and understand your data automation tools better.
Highlight a cell, see it highlight across nodes, branches and the canvas.
How to start ET1.
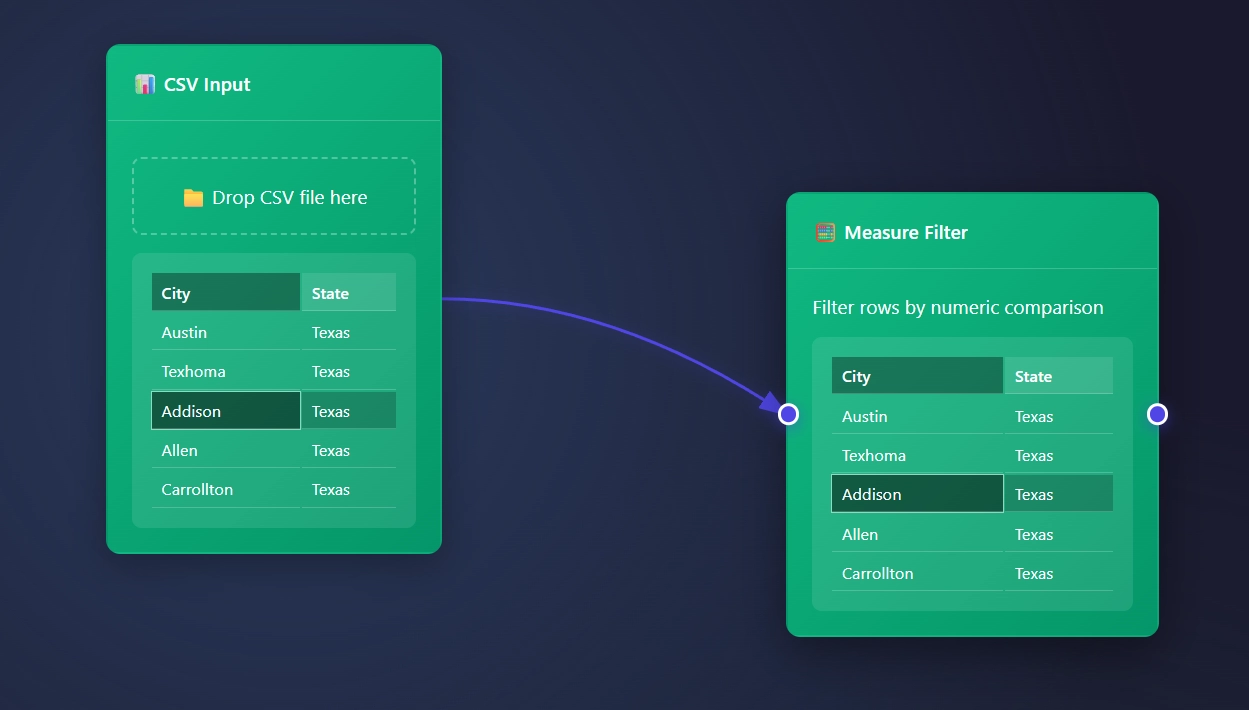
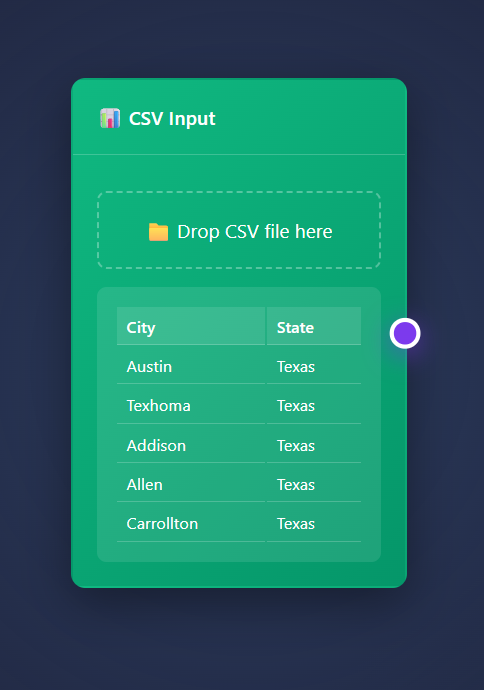
ET1 starts with a CSV Input Node open and available to begin slicing your data.
Csv file looks like file.csv and opens in ET1.
CSV data usually looks like…
City, State Austin, Texas Texhoma, Texas Addison, Texas Allen, Texas Carrollton, TexasConnecting the dots, creating connectors, drawing connections, the node menu
When highlighting on the right of a node with an output, you will find a circle.
This creates an arrow that can connect to the input of other nodes.
Node Quick Menu
Clicking the circle creates an arrow that points at a scrollable node menu, and automatically places the node directly to the right of your node.
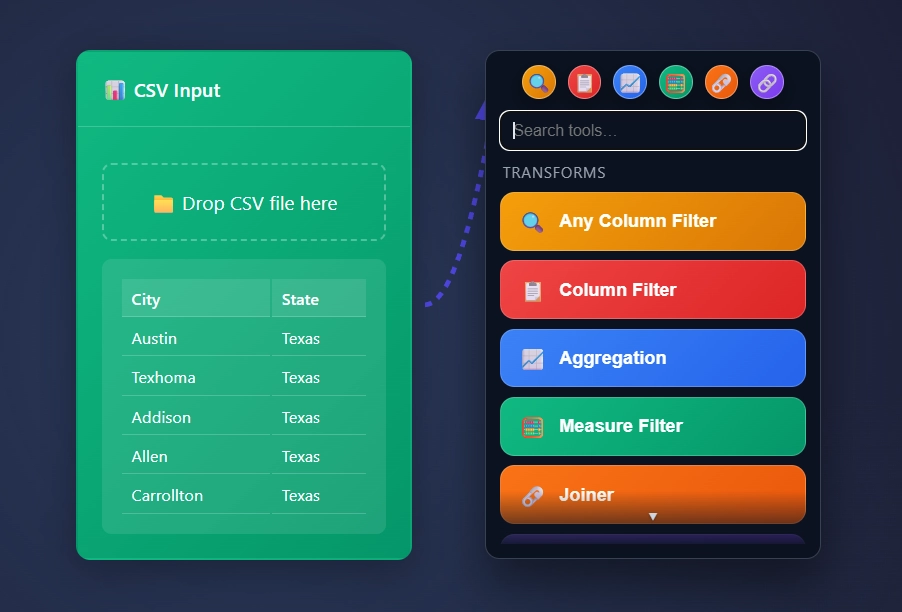
“Drag” the circle by clicking and dragging your mouse to create an arrow…
“Drop” the arrow by letting go of your mouse click into a blank canvas to create a scrollable node menu where you need a node to be placed.
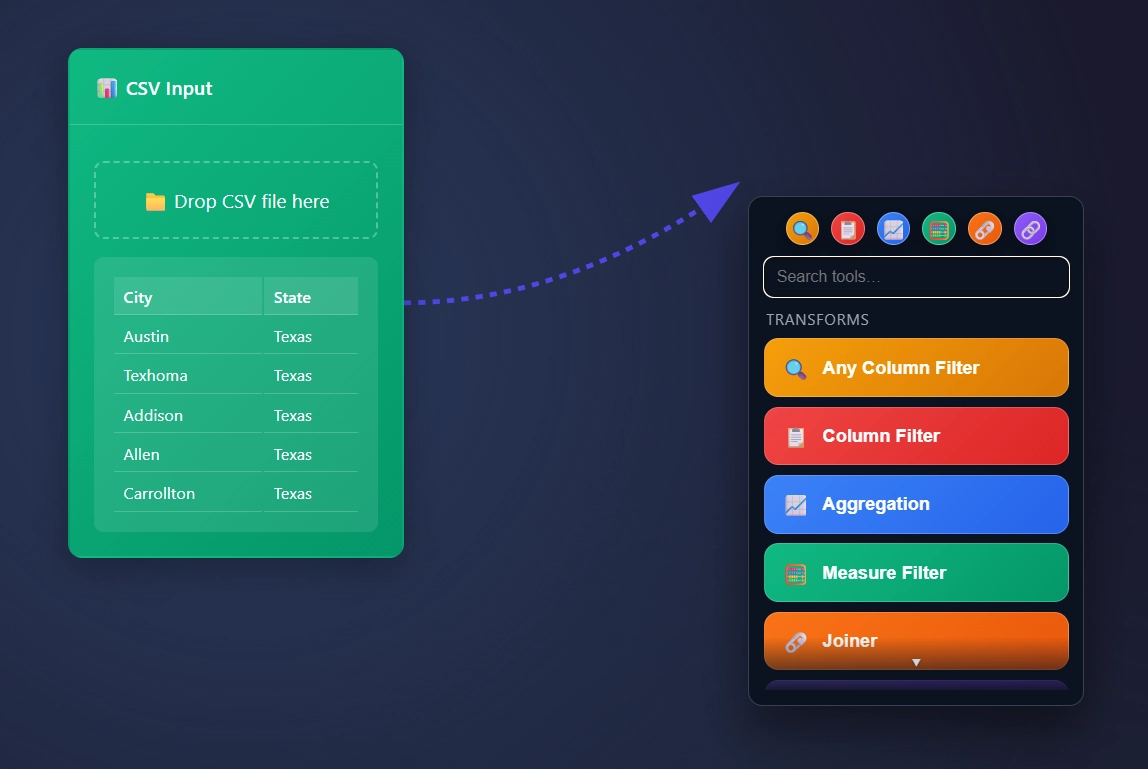
Drag the circle and drop.. not that crazy right!
Save your favorite nodes in the 6 circles in the top. Drag and drop the node/tool into the circle to save your favorite nodes, to make for an easier development lifecycle.
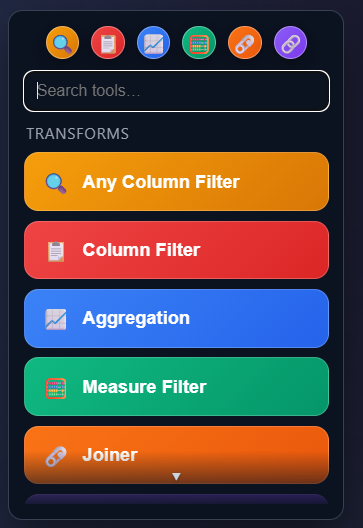
🛠️ Essential Nodes
- Input/Output
- CSV/JSON: Load data from files
- Manual Table: Type data directly
- Export: Save results
- Basic Transformations
- Filter: Show only what you need
- Sort: Reorder your data
- Column Renamer: Make headers friendly
🧪 Try This To Get Started Using ET1
- Add a CSV input node and load a file.
- Play with the data.
- See the results update instantly!
Questions? Please contact us.
Return to ET1 Overview to learn more.


