Trim/Normalize Node is built to help you quickly clean your data pipelines and like the Column Renamer, built to make data pipeline maintaining simple, not complicated, and more than anything, easy to repeat.
AT TIMES WE NEED CAPITAL LETTERS! Perhaps you-have-a-lot-of-this-happening (special characters you don’t ne3ed).
then there are times we aren’t trying to scream, and perhaps lowercase is a requirement for user names or emails. okay, you’re in a good place. case sensitivity is here too. AlongWithTrimmingWhiteSpace.
ET1’s Trim/Normalize Node helps people quickly clean their data.
You can select more than one column to clean, or just choose 1 column to normalize.
The Trim/Normalize Node was created to help you people quickly clean data pipelines and improve data quality across your data environment (a data environment might be a grouping of individual solutions that look and feel similar).
Cleaning dirty unstructured text for sentiment analysis, parsing HTML, or optimizing pipelines for data visualization – this node helps transition your pipelines into what some consider a piece of their overarching data governance.
Using the Trim/Normalize Node in ET1
Using this node is easy and intuitive. Checkboxes, drop downs, and nothing crazy.
Connect data downstream to your node, adjust the settings, and keep solving.
Connect data
Choose column(s)
Decide to trim ends – space(s) on the left and right only
Decide to remove whitespace – any and all space(s)
Remove special characters, any characters, includes spaces
Choose the case sensitivity
Real-world use case Trim/Normalize Node
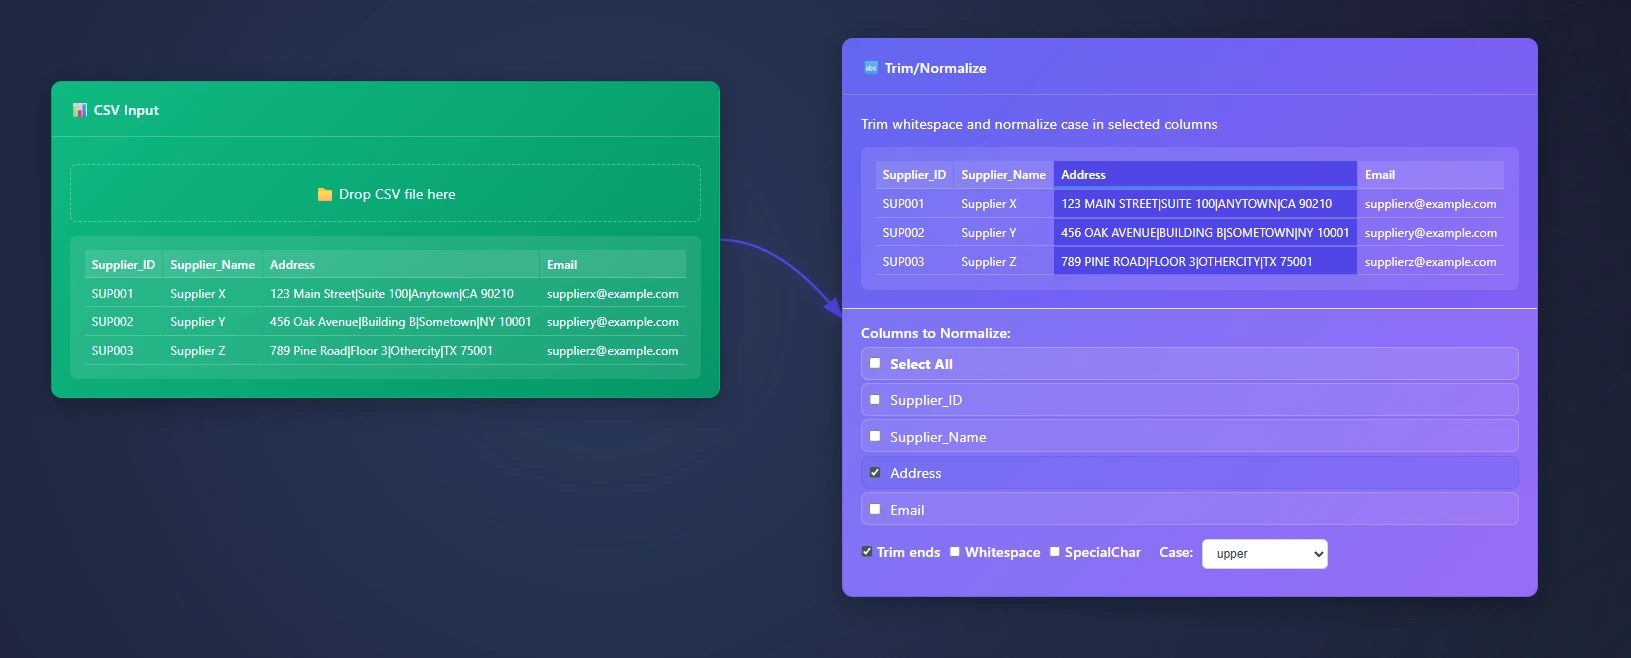
In this example we are gaining a file from an end user who needs help with capitalizing all of the Address.
Someone sends us this csv. We open it with the CSV Input Node in ET1 then we want to trim/normalize.
Supplier_ID,Supplier_Name,Address,Email
SUP001,Supplier X,123 Main Street|Suite 100|Anytown|CA 90210,supplierx@example.com
SUP002,Supplier Y,456 Oak Avenue|Building B|Sometown|NY 10001,suppliery@example.com
SUP003,Supplier Z,789 Pine Road|Floor 3|Othercity|TX 75001,supplierz@example.com
We are going to add trim ends, incase future data has padded spaces (thinking ahead), and swapping case to upper to follow internal best practices.
Upper case for Address passes this users current data strategy, their reasoning; some data inputs do not automatically swap to uppercase during the software writing to the database, and the software engineers don’t have time to optimize this part of the software.
Thanks for learning more about ET1 and know if you have any questions… Please contact us.
On your magic quest to join data? We call it the Joiner node.
A simple joining solution that helps people join data at a row level.
In ET1, Joiner is focused on “keeping it simple” and will aim to automatically infers your joins.
ET1 assumes.
Inferring a join means it assumes you prepared the data prior. Like, Id = Id..
Without preparing the data stream prior, the assumptions may fail. Use this to your power, and save time by letting ET1’s Joiner Node assume the correct column for you.
Hint; make it easier by preparing your column headers before using the Joiner Node by using the Column Renamer Node. This will help you save time while using ET1.
If your headers are clean this will automatically infer keys for you. What that means is it will try to find a join, without your help. However you may need to help it with doing the right thing if headers do not equal headers.
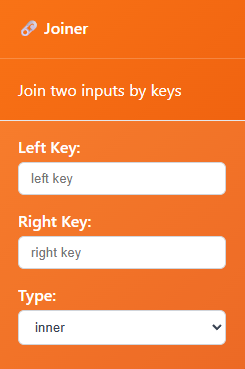
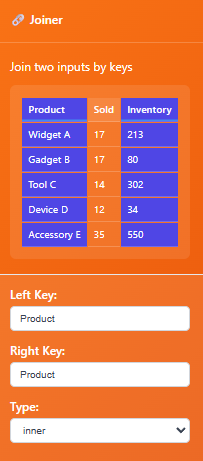
Connect table1, this will be the table on the “left” and we call it the left key
Connect table1, this will be the table on the “right” and we call it the right key
Pick type inner join or left* join
Right join is possible by swapping which table you connect to the Joiner node first. This order of operation is considered, and by adjusting what connects to this node first – you’re able to right join. You’re simple using the left join and the understanding of what you just read.
Type: The style of join. Today, we only have inner and left join.
The Joiner Node is the tool for joining data at a row-level, it removes complexities when joining data, and these row-level relationships are likely the ‘key’ we need to use the ET1’s Joiner Node.
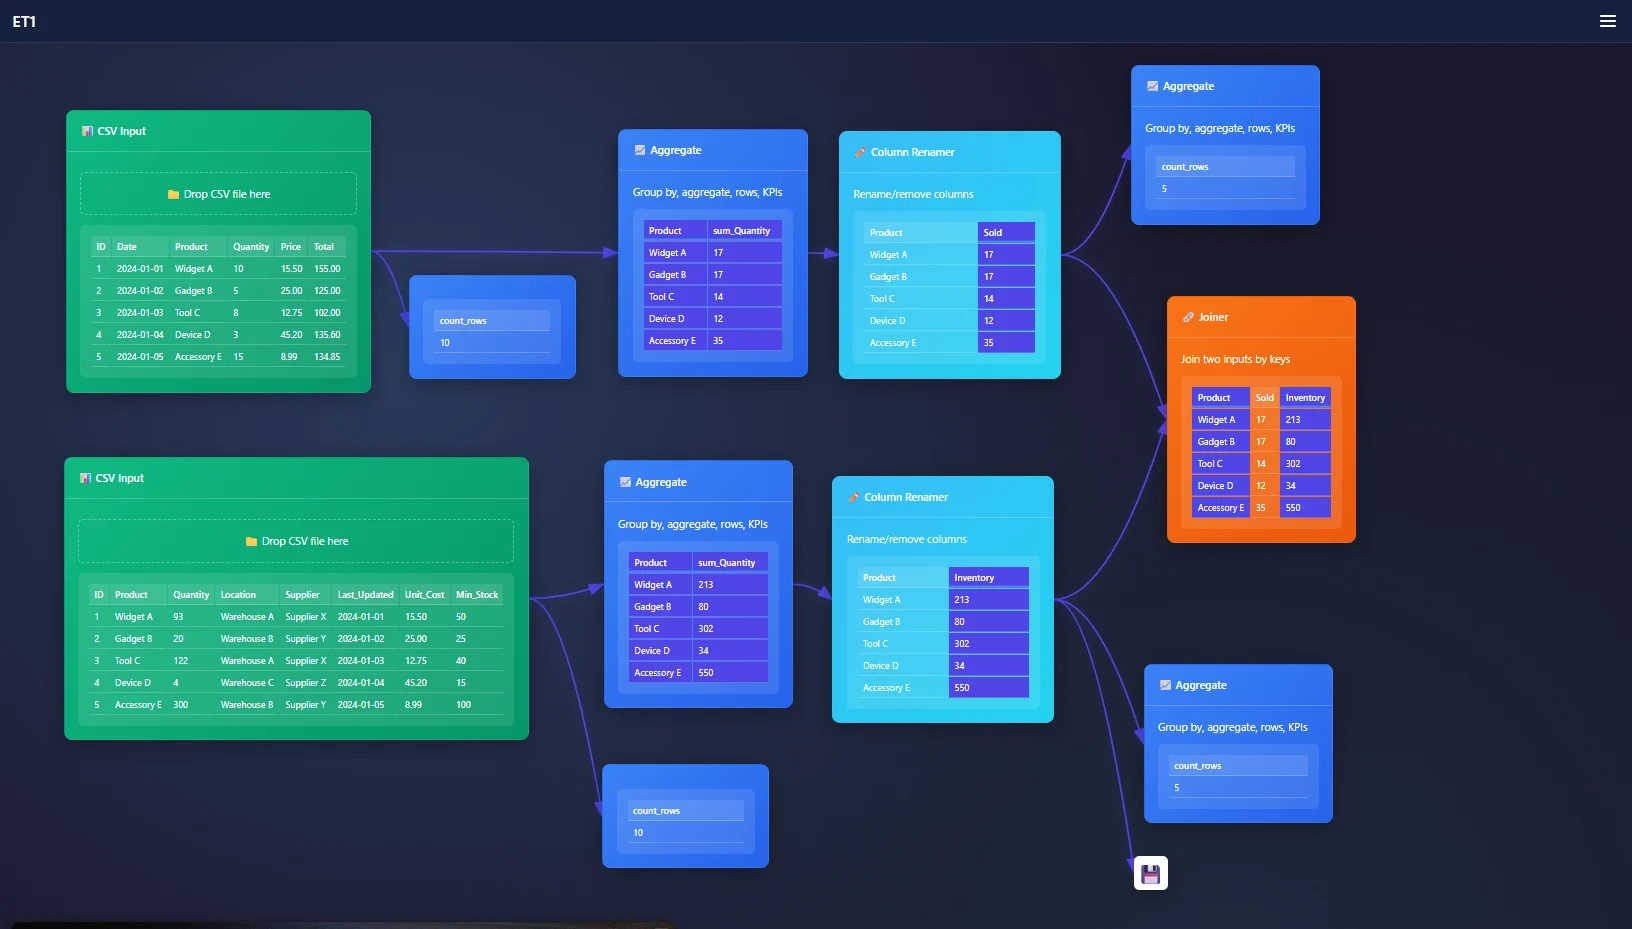
Goal, join our data to see if we need more inventory.
Problem, the data is broken into many different tables.
Use case: Purchase data and inventory data can be joined, lets break it down.
While analyzing this request, I found the data has duplicate entries on the column Product. Product has a relationship between tables. However we need the tables to be grouped, or we will be creating a many-to-many join.
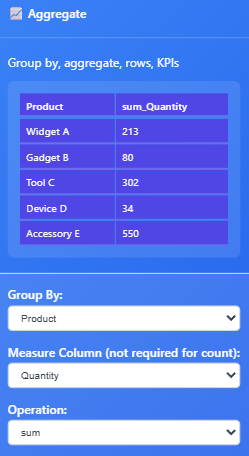
Here’s how our Inventory data will look after we group by Quantity, and rename our header to Inventory.
To create a KPI, you need to choose the column and how to aggregate.
Setting up your KPIs in ET1
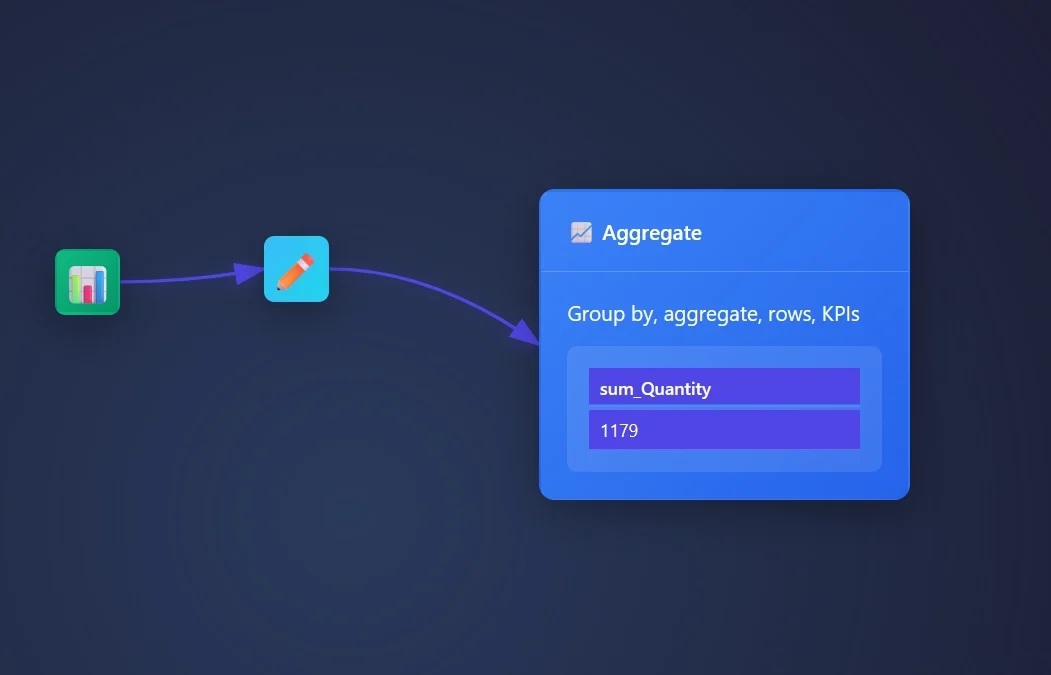
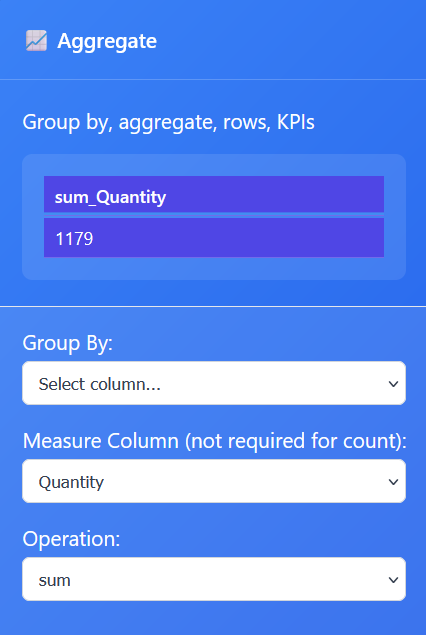
Open an Aggregate Node, stream data into this node, and open the settings.
We need to create a Sum of Quantity.
We need to swap the measure column to Quantity and the operation to sum!
Recap: The Aggregation Node operation is set to sum and the measure column is set to quantity and this creates a single KPI value for the column quantity.
The Split node lets ET1 user split one or more column into multiple columns.
This particular node is great for the times you have multiple rows of data with consistent delimiters.
The data we are splitting
Here is the CSV you need to follow the overview.
We will pass this data through the CSV Input Node!
Supplier_ID,Supplier_Name,Address,Email
SUP001,Supplier X,123 Main Street|Suite 100|Anytown|CA 90210,supplierx@example.com
SUP002,Supplier Y,456 Oak Avenue|Building B|Sometown|NY 10001,suppliery@example.com
SUP003,Supplier Z,789 Pine Road|Floor 3|Othercity|TX 75001,supplierz@example.com
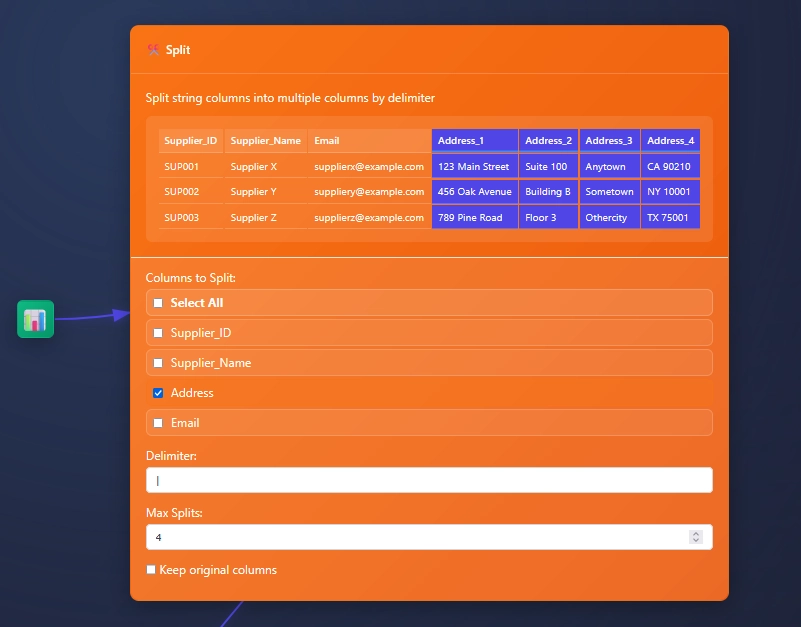
Splitting One Column
Splitting one column, like address in this example, can be by clicking one column, adding a delimiter, and setting the max amount of slits (or columns). Then choosing to keep original columns or not.
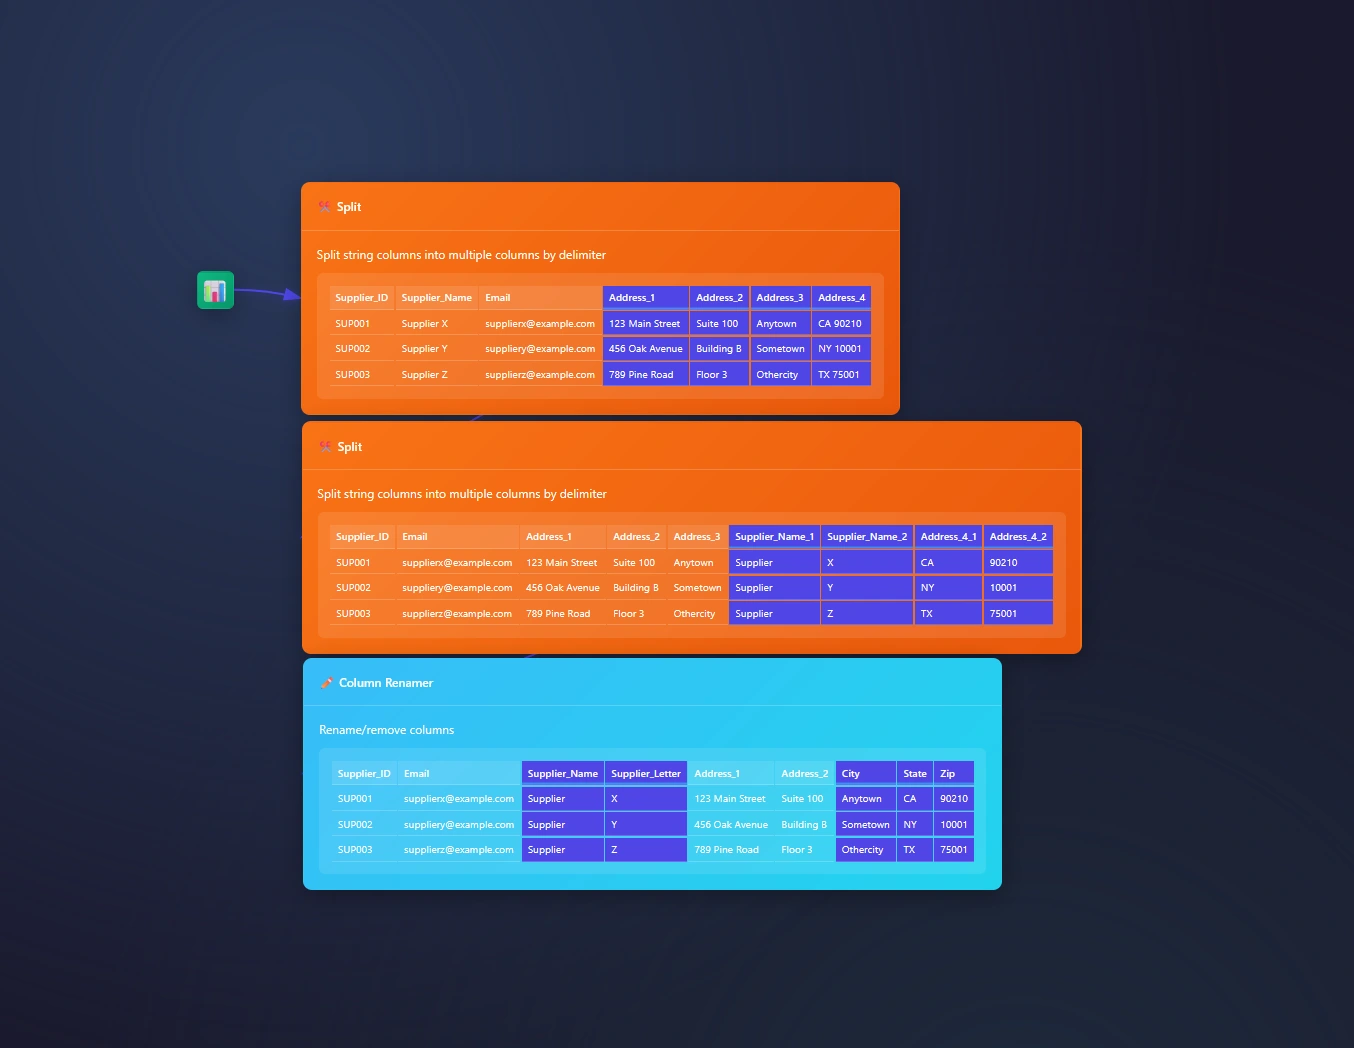
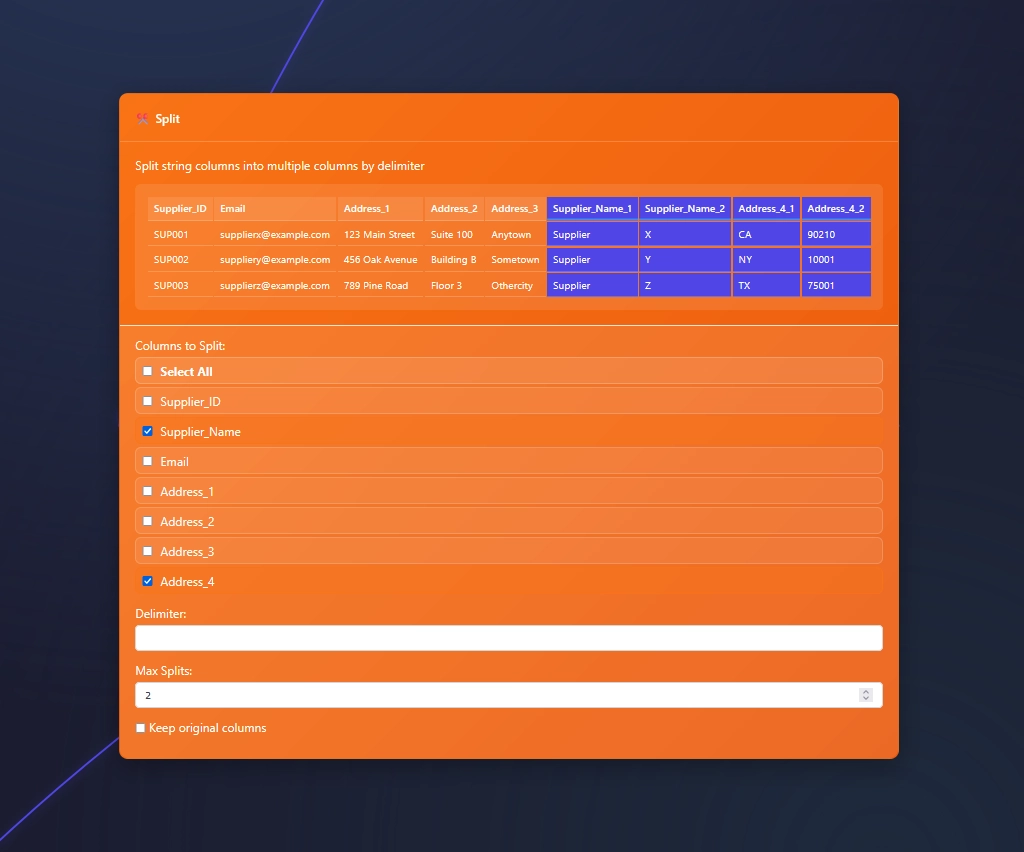
Splitting Multiple Columns
At times, while splitting data, you find a need to split more than one column with the same delimiter.
Splitting many columns to many columns is typical for parsing
In this example we need to split more than 1 column with a space and needing two splits.
Check more than one box and set your delimiter in the Split Node.