Aggregation, what a classic. Aggregating your data is a landmark trait for any data steward, data wrangler, or data analyst. In ET1, you can easily aggregate your data.
The Power of Grouping (Group By in ET1) with the Aggregate Node
Aggregations turn a sea of numbers into meaningful insights. Group by in ET1 is nested in the aggregate node.
Understanding how GROUP BY works in SQL is a life saver. However ET1 gives you the same super hero powers.
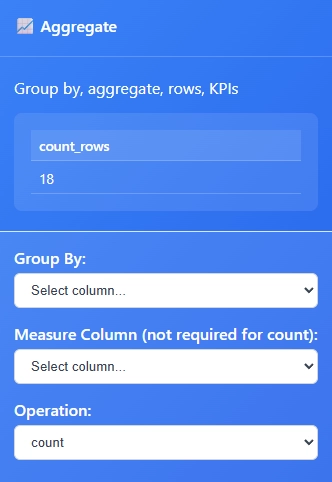
The Group By Node is the foundation of your aggregation
This lets you split the information across a non-aggregating column, otherwise you’re creating a KPI.
Create your KPI, understand the number of records, and various ways to aggregate.
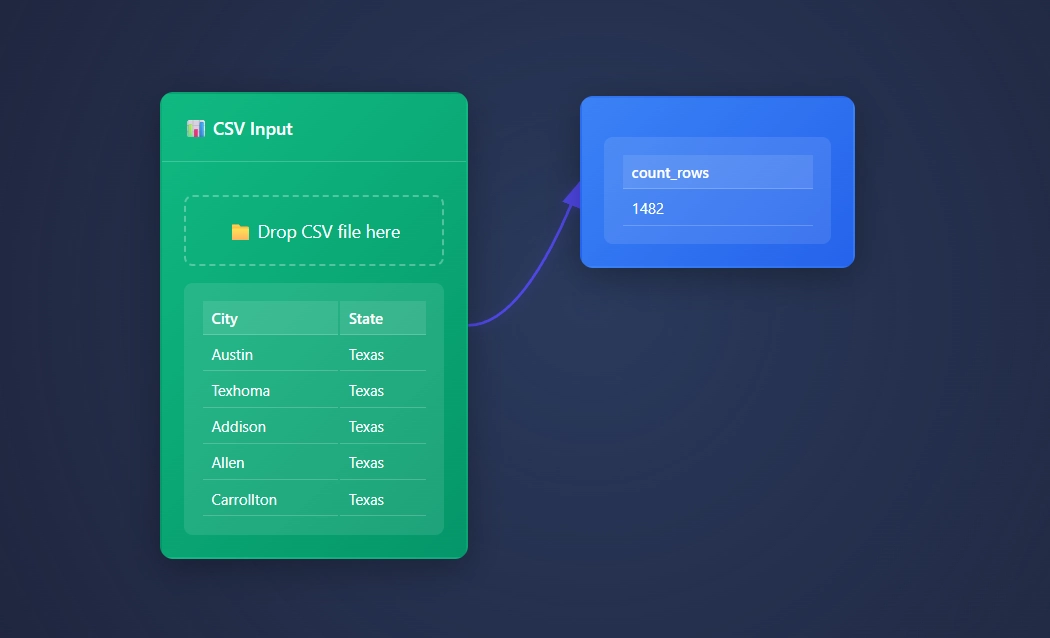
By default aggregation starts with count_rows to enable faster developer cycles.
🔢 The Essential Aggregations
- Sum
- Adds up all values
- Perfect for: Sales totals, revenue, quantities
- Average (Mean)
- Finds the middle ground
- Great for: Test scores, ratings, temperatures
- Minimum/Maximum
- Spot the extremes
- Use for: Price ranges, performance metrics, outliers
- Count
- Simple but powerful
- Tells you: How many? How often?
- Number of records
- by default, you will get the “number of records”
- you’re welcome!
- Count Distinct?
- Well, count distinct is nice but…
- This really means your data is duplicated!
🎯 Group By: The Game Changer
The real magic happens when you combine these with Group By:
- Sales by Region: Group by
Region, AggregateSum ( Revenue)
Real-World Examples
How would you aggregate in the real world?
E-commerce
- Total sales per city
- Average ticket sales per state
- Average order value by customer segment
Education
- Pass rates by subject
- Sum of students per day
- Average of students per month per class
Finance
- Monthly expenses by category
- Highest spending customers
Pro Tips
- Start Simple – Try one aggregation at a time
- Clean First – Make sure it’s just numbers or you’re not aggregating
- Check Your Groups – Make sure your groups make sense, very powerful for data reduction
Aggregation needs to be simple. Let us know if it’s not.
Return to ET1 Overview to learn more.


