In an increasingly data-driven world, harnessing massive volumes of information requires sophisticated, scalable, and resilient infrastructure. Historically, managing complex data pipelines required significant manual orchestration, lengthy development cycles, and a struggle to keep configurations robustly documented. However, Pipeline-as-Code has emerged as a groundbreaking methodology, enabling teams to programmatically define and version every aspect of their data infrastructure and workflows. By turning infrastructure into clearly defined, reproducible code, businesses can optimize for agility, governance, and operational efficiency. If your organization intends to elevate its data-driven decision-making, understanding and leveraging Pipeline-as-Code becomes pivotal to maintaining market leadership.
Why Pipeline-as-Code is Transforming Data Operations
Pipeline-as-Code revolutionizes data operations by adopting the principles and best practices of software development. Traditionally, data workflows might have involved cumbersome manual setups or scripts scattered across different platforms—making them difficult to maintain, update, or track. However, Pipeline-as-Code centralizes all definitions, making deployments fully automated, repeatable, and auditable. This structured methodology not only increases developers’ and analysts’ productivity but helps mitigate the risk of costly human errors in data-intensive environments.
By relying on historical version control tools like Git combined with familiar CI/CD workflows, Pipeline-as-Code provides teams a consistent, repeatable method for updating, deploying, and validating data transformations and analytics flows. Changes are documented naturally as part of the regular software development lifecycle, significantly enhancing traceability, auditability, and troubleshooting capabilities.
Pipeline-as-Code also supports greater collaboration across departments. Analysts, data engineers, and software developers can review, track, and approve pipeline updates together, promoting a unified understanding of infrastructure and processes. Businesses that embrace this method can witness substantial gains in speed, transparency, compliance, and ultimately, higher return-on-investment from their data analytics endeavors.
The Essentials of Pipeline-as-Code: Modern Techniques and Technologies
Infrastructure Declarative Frameworks
At its core, Pipeline-as-Code depends on declarative infrastructure-as-code frameworks like Terraform, Kubernetes configuration files, and CloudFormation. These technologies allow organizations to define the exact state their infrastructure needs to reach, rather than scripting manual procedural steps. Using declarative infrastructure, your data team can automate the deployment and management of data warehousing infrastructures seamlessly. Effective implementation of these infrastructures plays a critical role in successfully managing analytics workloads, a topic discussed extensively across resources like our data warehousing consulting services page.
Pipeline orchestration solutions like Apache Airflow or Dagster enable data engineers to programmatically define complex pipeline dependency graphs, scheduling requirements, and error-handling procedures. Organizations can version-control their pipelines, significantly facilitating iterative improvements and collaboration on data transformations. Such automation not only accelerates delivery but also improves accuracy and reliability of analytics reports and intelligence insights across an enterprise.
Embracing Containerized Data Pipelines
Container technologies such as Docker dramatically simplify developing, packaging, and maintaining pipeline environments. Leveraging containers empowers data teams to quickly launch tasks within consistently reproducible environments, eliminating drift between stages from dev to production. When combined with orchestrators like Kubernetes or cloud-managed container services, these containerized pipelines scale efficiently, dynamically optimize resource utilization, and simplify testing and deployment, thus enhancing the organization’s agility in addressing rapidly evolving analytics requirements.
Leveraging Advanced Analytics with Pipeline-as-Code
Optimizing Data Access and Analytics Efficiency
Implementing Pipeline-as-Code facilitates sophisticated data access patterns. Utilizing fast indexing solutions like the ones detailed in our blog “Enhancing Data Retrieval with Indexing in SQL” and “Spatio-temporal Indexing Structures for Location Intelligence“, data engineers can dramatically improve the responsiveness and efficiency of analytical queries. Proper indexing combined with Pipeline-as-Code means consistently deploying optimized data schemas designed for maximum querying performance.
Innovative analytical approaches like predictive modeling can also leverage Pipeline-as-Code as demonstrated in “Mastering Demand Forecasting with Predictive Analytics“. Pipelines codified with machine learning libraries and models enable your business to continuously evaluate predictions, automatically retrain models with new datasets, and effortlessly deploy analytics-driven insights that directly influence operational decisions.
Real-time Analytics and Telemetry Integration
Data analytics is no longer confined strictly to batch processing, as organizations increasingly demand near-real-time visibility into operational intelligence. Utilizing telemetry patterns within microservice architectures as discussed in the blog “Microservice Telemetry Aggregation Patterns for Real-time Insights“, Pipeline-as-Code becomes indispensable. Integrating real-time analytics streams within coded pipelines allows businesses to quickly identify anomalies, make proactive adjustments, and respond to emerging conditions in dynamic marketplace environments.
Improving Governance and Observability through Pipeline-as-Code
Visualizing Data Lineage for Enhanced Governance
Pipeline-as-Code goes beyond merely deploying data workflows: it integrates seamlessly with metadata management, enabling businesses to track data flow comprehensively. Tools and techniques from the article “Graph-based Data Lineage Visualization” help organizations trace data provenance clearly—from source ingestion to warehousing, visualization, and eventual archiving.
Effective data governance relies heavily on accurate lineage information. Pipeline-as-Code allows data teams to embed lineage tracking directly within code-based pipeline frameworks. It becomes easier to diagnose data quality issues, validate compliance with industry regulations, and proactively communicate organizational insights to key stakeholders, establishing trust in your data-driven strategies.
Optimization Techniques for Data Pipelines
Using advanced optimization approaches such as the Bloom filter discussed in “Bloom Filter Applications for Data Pipeline Optimization“, organizations can greatly improve pipeline fidelity. Such optimized and tested filters ensure only pertinent data passes efficiently into analytic workflows, reducing storage and processing overheads and significantly enhancing pipeline flow management clarity.
Implementing Pipeline-as-Code in Your Organization
Aligning Technology and Strategy
When implementing Pipeline-as-Code, it’s vital to align technical adoption with broader organizational strategies. Decision-makers must grasp not only the technical advantages—scalability, maintainability, reliability—but also how these translate into business outcomes. Real-world case studies, such as “Using Data Analytics to Improve Transportation in Austin, Texas“, showcase the tangible community benefits achieved through strategic data analytics and underscore Pipeline-as-Code’s potential value.
Promoting strategic professional networking within the data science community—highlighted in “The Art of Networking with Data Science Professionals“—provides frameworks for gaining implementation insights from direct industry experience. Leveraging the right partnerships and experience significantly improves the chance of success when adopting Pipeline-as-Code.
Realizing Pipeline-as-Code Benefits Step-by-Step
Adopting Pipeline-as-Code should commence with clearly defined pilot projects showcasing quick wins to illustrate value early in deployment. For example, simple data movements like export scripts (Send Instagram Data to Google Big Query using Node.js) can serve as proof-of-concept milestones demonstrating Pipeline-as-Code viability quickly and effectively, validating senior-level confidence gradually building towards complete pipeline automation.
Ultimately, Pipeline-as-Code implementation requires executive sponsorship and effective stakeholder engagement. With the right preparation, strategy, tools, and partnerships, your organization can realize immense benefits—including improved reliability of insights, enhanced observability, higher data governance confidence, and faster innovation.
In the fast-paced world of data analytics and innovation, businesses constantly seek strategies to streamline their operations, enhance reliability, and utilize data-driven insights for decision-making. As data volumes grow exponentially, so does the complexity of managing data pipelines. A common hurdle faced by organizations lies within efficiently resolving dependencies and scheduling jobs across complex data streams. Without a robust approach to data pipeline dependency resolution and scheduling, workflows become bottlenecks instead of catalysts for growth. Fortunately, leveraging advanced strategies and technologies can transform outdated manual practices into optimized automation, unlocking transparency, accuracy, and speed. In this guide, we’ll explore key considerations and best practices for managing data pipeline dependencies and scheduling effectively, enabling your organization to scale successfully while ensuring data integrity and availability.
The Importance of Data Pipeline Dependency Management
Data pipeline dependency management deals with understanding and orchestrating interdependencies among various tasks, jobs, and processes that constitute your overall data architecture. Each step within a data pipeline usually depends upon successful execution of previous tasks, meaning any missed or delayed step can cascade into serious downstream problems.
Effective dependency management provides clear visibility into how data flows through your systems, helping detect potential points of failure early and minimizing business disruptions. Dependable pipeline management ensures that data is consistently reliable for analytics, allowing companies to make confident data-driven decisions. With well-orchestrated dependencies, businesses can avoid costly downtimes and inefficiencies that negatively impact productivity and user trust.
Moreover, clearly defined dependencies facilitate better graph-based data lineage visualization, simplifying the tracing of information through complex workflows. Visualizing the dependencies helps stakeholders quickly understand the big picture and identify the precise locations where bottlenecks or errors could occur, aiding faster troubleshooting and system optimization.
In the current competitive landscape, accurate dependency management is no longer optional—it’s essential. Companies that invest in robust dependency management solutions position themselves ahead of competitors by enhancing their data systems’ reliability, resilience, and agility, thus unleashing their complete growth potential through data analytics.
Advanced Approaches for Resolving Dependencies Across Data Pipelines
Modern data infrastructure often comprises microservices, real-time streaming platforms, batch processing tools, and cloud-based data warehouses. Such hybrid environments inherently increase the complexities associated with dependency resolution. To address these challenges, businesses need to implement advanced techniques in managing data architecture.
One successful approach involves adopting modular and decoupled data architecture patterns. A modular approach—such as those outlined in our article on data architecture patterns for microservices—provides increased flexibility by reducing tight coupling among services. When data pipelines are modularized, components can be independently developed, deployed, and scaled, each clearly delineating their own dependencies. Through modularity, teams can quickly pinpoint problems and seamlessly adjust individual pipeline segments without disrupting the entire infrastructure.
Another critical advancement is the implementation of automated dependency detection tools. Intelligent platforms utilizing machine learning algorithms can dynamically analyze workflow logs and pipeline metadata, automatically identifying and visualizing dependencies that humans might overlook. These platforms can proactively notify teams of atypical or shifting dependency patterns, mitigating unforeseen risks promptly.
Furthermore, maintaining transparency through data lineage and metadata repositories significantly simplifies dependency identification. Leveraging modern lineage tools reduces guesswork, improves accuracy, simplifies version control, and dramatically reduces the operational risk involved with pipeline management.
Effective Scheduling: Maximizing Efficiency and Reliability
Effective scheduling is intrinsic to a reliable data pipeline. It means orchestrating dependent tasks, jobs, and workloads so they run in harmony—avoiding resource contention, ensuring consistent completion times, and maximizing overall efficiency. Poor scheduling often leads to pipeline latency, delayed decisions, and reduced trust, whereas strategic scheduling amplifies responsiveness and operational agility.
To schedule effectively, consider intelligent automation that harnesses historical data to predict job completion times and to adjust timing accordingly. Scheduling solutions now incorporate sophisticated machine learning algorithms—highlighted in our article covering analytic tools and technologies—to forecast optimal schedules based on real-world pipeline performance data. Such analytics-informed scheduling proactively addresses frequent bottlenecks, ensures accurate resource allocation, and enhances pipeline reliability over time.
Moreover, event-driven pipeline scheduling empowers businesses to initiate workflows in real-time whenever specific conditions, data-ingestion, or processes occur. Unlike purely time-based scheduling that can fail to account for variable realities, event-based scheduling fosters responsiveness and increases adaptability. Organizations moving toward real-time analytics and decision-making should transition to event-driven scheduling models to align their analytics strategy seamlessly with business goals.
In this pursuit of effectiveness, scalable scheduling methods enable you to handle increased demands smoothly. Our guide on scaling data infrastructure demonstrates how thoughtfully planned and orchestrated scheduling facilitates continuous growth, reduces execution time, and supports seamless operations without compromising performance.
Security and Ethical Considerations in Pipeline Management and Scheduling
Dependency and scheduling processes within a data pipeline can inadvertently introduce vulnerabilities and ethical concerns that organizations must proactively address. Sensitive data often travels through data pipelines, which calls for stringent measures to protect against unauthorized access or malicious activities. Employing enhanced security practices—such as adopting quantum-resistant encryption—ensures confidentiality and integrity as your information moves across various stages of processing and storage.
Also, responsible and transparent data pipeline management involves recognizing and addressing potential biases embedded within data workflows. Integrating bias detection algorithms and monitoring standards—examined in our piece about ethical considerations in data analytics—helps companies proactively correct unintended biases before they propagate harmful outcomes in decision-making.
The era of privacy-preserving technologies has arrived, further highlighted by advancements like homomorphic encryption. By allowing computations on encrypted data without revealing sensitive content, organizations can operate data pipelines with greater privacy confidence. Incorporating robust privacy management into your pipeline framework communicates to stakeholders and customers alike your organization’s commitment to responsible and ethical data stewardship.
Roles and Responsibilities: Aligning Teams for Success
Understanding the distinctions between various team roles, such as data engineers and data analysts, ensures effective strategizing and management of pipeline dependencies and schedules. As we described extensively in our article highlighting the differences between data engineers and analysts, each role has distinct responsibilities and skillsets.
Typically, data engineers develop, maintain, and optimize the pipelines, ensuring smooth data flow, reliability, and system integrity. Meanwhile, data analysts consume the output of these pipelines to generate valuable insights for decision-making. Aligning these two critical roles, clarifying expectations, and improving cross-team collaboration avoids misunderstandings, minimizes errors arising from lack of clarity, and speeds project execution.
In addition, clear documentation, training programs, and role-based access controls can further support alignment among teams, ensuring everyone understands their responsibilities in resolving pipeline dependencies and managing scheduling effectively. With team roles properly defined and aligned, organizations cement the foundation for reliable, scalable, agile, and ethical pipeline operations that propel continual innovation and meaningful business outcomes.
Conclusion: Investing in Your Data Pipeline Strategy
Strategically handling data pipeline dependency resolution and scheduling is no simple feat, yet it is critical for modern organizations seeking reliable analytics, scalability, operational efficiency, and secure handling of sensitive data. To support rapid innovation and data-driven insight, companies must continuously evaluate and evolve their pipeline practices, technologies, and ethical standards.
Partnering with expert consultants and leveraging advanced analytics solutions like those offered in advanced analytics consulting services helps streamline complexity and ensures your business remains ahead of technological advances. Companies that invest thoughtfully in their data infrastructure sleep soundly knowing their pipelines are robust, secure, efficient, and adaptable to future changes, laying a strong foundation for scalable growth and sustainable success.
Tags: Data Pipeline Management, Dependency Resolution, Pipeline Scheduling, Advanced Analytics, Data Architecture, Data Infrastructure Strategy
Visualizing flow data accurately and intuitively is fundamental to making informed decisions across industries such as aerospace, automotive engineering, meteorology, and even financial modeling. Leveraging advanced visualization techniques empowers decision-makers to interpret complex vector fields, translating detailed flow patterns into actionable insights that shape strategy and innovation. Whether analyzing airflow across aerodynamic surfaces or mapping ocean currents for renewable energy initiatives, effective visualization allows professionals to quickly decipher large datasets, identify key trends, and formulate impactful strategies. This article explores powerful and impactful vector field visualization techniques used to represent flow data clearly, aiding stakeholders in turning data-rich environments into precise, strategic decisions.
Comparing 2D Vector Field Visualization Methods: A User Study
Why Vector Field Visualization Matters in Data Analysis
Vector field data is abundant in many complex domains from computational fluid dynamics to electromagnetism. This data typically consists of direction and magnitude components at multiple points in space, creating datasets often challenging to visualize clearly. Understanding vector fields is crucial, especially when precision is paramount in product designs, simulation accuracy, or predictive analysis, such as airflow simulations for aircraft or fluid flow analyses in hydraulic systems. Poor visualization practices can lead to misunderstood data, incorrect formulations, and costly design errors.
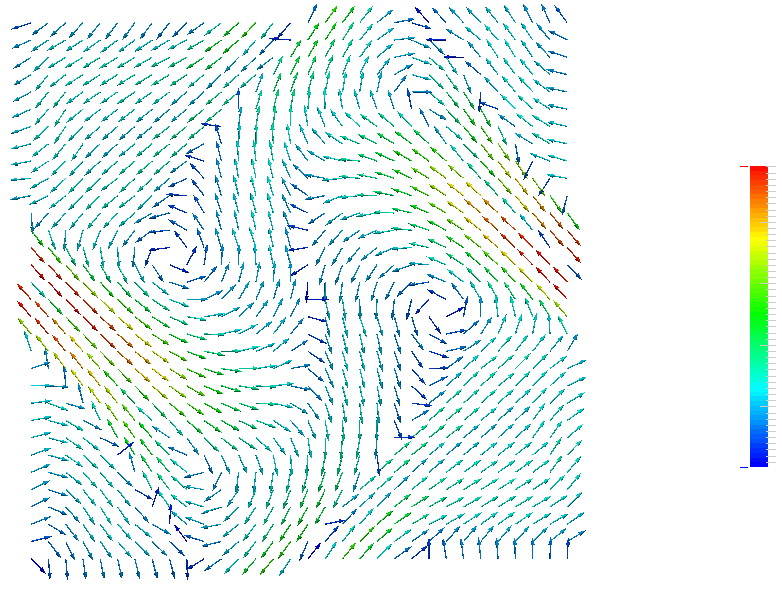
Effective vector field visualization techniques can elucidate intricate patterns such as vortices, turbulence zones, and critical points in fluid dynamics data, providing engineers and analysts clarity to guide decision-making and strategy development. Furthermore, the ability to visualize data effectively has significant implications beyond engineering; industries leveraging strategic data literacy, from pharmaceutical companies modeling drug dispersion to oceanographers studying intricate marine currents, heavily depend on clear visual communication. Companies investing in expert guidance, such as those specializing in advanced Tableau consulting services, understand the necessity of strategic data visualization. By strategically deploying specialized vector field visualization techniques, organizations ensure comprehensive interpretation, minimize analytics uncertainty, and elevate data-driven innovation.
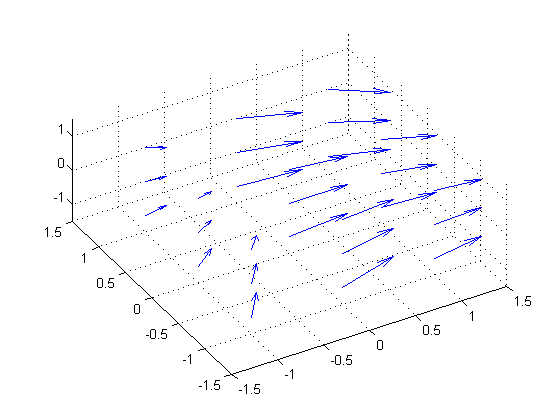
Arrow Glyphs: Direct Visualization of Magnitude and Direction
Arrow-based glyphs represent perhaps the most intuitive and direct method for visualizing vector fields, with each arrow glyph illustrating both the direction and magnitude of vectors at discrete points in space. By positioning arrows onto spatial grids or irregular measurement points, analysts can immediately understand the flow structure, directional trends, and local behaviors within the data. The length of each arrow typically corresponds directly to vector magnitude, providing an efficient visual representation that can quickly highlight areas of interest, such as regions of high flow velocity or vortex formation.
However, relying solely on arrow visualizations does have limitations. Large data fields densely packed with arrow glyphs may suffer from cluttering effects, obscuring subtle or intricate underlying flow structures. Analysts often address this by strategically optimizing arrow glyph density or employing filtering techniques. For further enhancements in handling visual clarity and effective presentation, exploring popular data visualization tools and their unique features can streamline developing clear visual strategies. Techniques such as spatial sampling or selectively displaying arrows only above a certain magnitude threshold maintain essential information visibility without sacrificing clarity. Moreover, organizations transitioning from basic spreadsheet tools to data visualizations will find valuable guidance in articles explaining how to transition from Excel to data warehousing effectively.
Streamline visualization techniques overcome many clarity challenges inherent to arrow glyph displays. Streamlines visualize flow data by illustrating the paths that massless particles would follow as they move within the vector field, yielding smooth and continuous curves. These visualizations interpret complex vector data more intuitively, allowing analysts and decision-makers to quickly grasp overall flow structures and current trajectories. This can be particularly valuable in aerodynamic simulations or understanding how liquids disperse in products such as medical aerosol sprays or chemical reactors.
Streamlines excel at showing how fluid flows around objects or how air circulates within complex enclosures, allowing stakeholders to immediately recognize patterns such as recirculation zones, stagnation points, and boundary interactions. When approaching large datasets, selecting intelligent seed placement strategies is vital, as the positioning significantly affects visual clarity. Consulting experts in data visualization can dramatically streamline this complexity. Advanced Tableau consulting services offer specialized assistance to refine streamline visualizations, optimize seed point allocation, and deliver insight-driven visualizations tailored for decision-making contexts.
Contour and Scalar Mappings: Using Color and Texture effectively
Another strategic visualization method involves transforming vector components into scalar fields—such as velocity magnitude or vorticity—to render informative contour or color map visuals.
Textures, shading, and gradient-based coloring reveal subtle variability across vector fields, clearly highlighting quantitative information in user-friendly formats. Scalar mappings such as heat maps or contour plots present underlying flow dynamics elegantly, ensuring seamless comprehension amongst technical and non-technical stakeholders alike. Meteorologists leverage similar techniques in mapping wind intensity in weather models; aerodynamicists utilize them to analyze airflow velocity gradients across aerodynamic surfaces.
Choosing optimal scalar transformations demands attentiveness to analytical contexts, as these visualizations are sensitive to data representation decisions. Color scales necessitate thoughtful consideration to avoid misleading perceptual biases; thus, strategic visualization expertise or consulting resources become valuable to ensure the communication of decision-critical insights accurately. For further exploration into comparative effectiveness between visualization techniques and tools, reviewing guides such as the detailed overview described in the comparison of popular data visualization tools can provide organizational clarity.
Animated Vector Field Visualization: Adding the Dimension of Time
Adding animation to vector field visualizations introduces the critically informative dimension of temporal variability, demonstrating how fields evolve dynamically over time.
Animated representations allow decision-makers to comprehend complexities inherent in transient phenomena, such as turbulent flow physics, changes in electromagnetic fields, or growth patterns in cellular flows in biological research. By visualizing time-sequenced data, organizations can effectively analyze flow stability, transient responses, peak flow conditions, as well as forecast or anticipate future conditions, capabilities especially critical for industries dependent on accurate predictive modeling and scenario planning.
While animation provides exceptional value, managing computationally heavy workloads requires careful data infrastructure optimization. Small to mid-sized teams can significantly enhance their visualization output by investing in robust data engineering frameworks—a concept thoroughly discussed in data engineering for small teams, which emphasizes maximized impact with strategic investment in analytics infrastructure. Stakeholders should also consider performance trade-offs displayed in animated visualizations and direct querying of data resources as outlined comprehensively in the analysis of Import vs. Direct Query in Power BI, which serves as a helpful companion resource for strategic analytics tooling decisions.
Data-Driven Innovation: Leveraging Visualization to Uncover Insights
Beyond merely aiding comprehension, effective visualization capabilities stand at the core of data-driven innovation. Visualizations empower teams to explore datasets comprehensively, identify previously hidden structures or patterns, and devise innovative strategies that drive competitive advantages and operational enhancements. Leveraging powerful visualization techniques, from arrow glyph representations to temporal animation, positions analysts and decision-makers alike to derive meaningful insights alongside robust data mining practices.
Detail-oriented analytics teams pairing visualization methods with established data mining techniques form a potent combination, uncovering insight treasures previously inaccessible within complex data environments. Incorporating expert curated techniques for efficiency improvements, such as those illustrated in practical resources like Tableau quick win date buckets, further refines an organization’s analytical agility, translating big-data complexities into compelling visual narratives for clear strategy formulation.
In conclusion, mastering vector field visualization allows companies and decision-makers to fully leverage intricate flow data, transforming complex data challenges into decisively harnessed competitive opportunities. Leveraging professional guidance and strategic visualization expertise positions data-savvy organizations ahead, equipped with clarity, confidence, and innovation-driven momentum.
As organizations continue to scale their data analytics capabilities, the complexity and sensitivity of their data often intensify rapidly. Data security has evolved from a best practice into an absolute strategic imperative. Row-level security (RLS) has emerged as a powerful mechanism, empowering organizations to granularly govern data visibility based on user contexts. When implemented skillfully, RLS doesn’t just bolster your data security—it unlocks new avenues for innovation, collaboration, and informed decision-making. In this strategic guide, we’ll discuss how meticulously applying row-level security within your data transformation workflows not only enhances security measures but also ensures seamless, precise, and tailored analytics for every stakeholder within your organization.
Understanding Row-Level Security and Its Strategic Importance
Row-level security refers specifically to controlling access to individual data records or rows present in a database or analytics platform. It grants data administrators granular control, empowering them to dictate exactly who can view particular subsets of data. Instead of managing permissions at a table or database level—which is typically broad and insufficiently flexible—RLS enables finely-tuned access tailored toward user attributes such as departments, roles, geography, or organizational hierarchies.
The strategic benefit of adopting RLS is multifaceted. Importantly, it reduces risk exposure for sensitive data, ensuring only the authorized personnel can interact with critical or confidential information. Beyond security, RLS strategically supports the accuracy and efficacy of analytics initiatives—particularly in complex organizations where personalized visibility brings clearer insights and more immediate, actionable outcomes. For example, a regional sales manager accessing a data dashboard would automatically see only sales data relevant to their geographic scope, eliminating distractions and emphasizing operational relevance.
The power of RLS lies in providing the flexibility for scalable security that adapts dynamically to organizational structures and changing access requirements. Smartly implementing row-level control encapsulates meticulous data governance principles, enabling organizations to stay compliant and competitive as data privacy regulations continue tightening around the globe.
Data Preparation & Role Assessment for Row-Level Security
The successful implementation of row-level security begins with strategic data preparation and rigorous user role assessment. Data practitioners must first audit current data assets objectively, mapping sensitivity levels, hierarchical relationships, and the organization’s legal or compliance-related obligations. Taking such structured preparatory steps will significantly streamline the implementation process while minimizing exposure to regulatory compliance risks.
With your data clearly delineated, a comprehensive role assessment is paramount. Identify user roles, understand each role’s specific requirements, and thoroughly document users’ information access scenarios. Collaborate closely with stakeholder representatives from each team or business segment to ensure no critical detail is overlooked. Leveraging resources such as our PostgreSQL consulting services can provide valuable aid in expertly navigating the RLS implementation process, helping your business avoid potential oversights and pitfalls.
This collaborative effort empowers organizations to implement RLS smartly and accurately at scale, enhancing data-driven decision-making processes. After all, strategic role assignment optimized for row-level security greatly improves user experience by empowering each stakeholder to interact precisely with analytics that reflect their direct operational responsibilities.
A Technical Roadmap for Implementing Row-Level Security in Data Workflows
Transforming your RLS strategy from concept to practical implementation demands a technical roadmap. Initially, decide upon the database or analytics platform most aligned with your organizational goals. Technologies such as PostgreSQL provide precise tools and robust support for row-level security solutions. PostgreSQL, in particular, stands out due to its proven community-supported security features, extensive user base, and flexible integration capabilities.
To begin incorporating row-level security practically, optimize your implementation efforts using comprehensive data workflows. Building a data workflow helps clearly define data transformations, identify filtering logic, and specify conditions under which access to certain data rows is permitted. Businesses can leverage robust data science and analytics environments, like those covered in our guide on how to setup Anaconda3, a data science toolkit, to thoroughly test and validate RLS rules with precision and accuracy.
Establish well-defined, validated conditions and policies at this stage to intelligently streamline your organization’s RLS approach. Documenting all implementation stages clearly ensures easy maintenance and highly efficient troubleshooting in the future, contributing positively to overall system robustness and longevity.
Advanced Implementation Considerations for Complex Data Scenarios
Strategically managing row-level security becomes more challenging with complex and large-scale data scenarios. However, complexity is also an opportunity to demonstrate leadership through innovation. Complex data environments often involve multi-dimensional tables, diverse user hierarchies, or multi-modal datasets—such as those described in our article on multi-modal sensory analytics integrating audio-visual and text data.
When addressing these complex requirements, consider implementing context-aware RLS approaches. Contextual rules can conditionally grant or restrict data access based on various interconnected factors—geography, timing, volume, or dynamic user profiling information, significantly enhancing user experience through intuitive and appropriate information access.
Moreover, technologies like quantum computing promise unprecedented data processing capabilities, potentially amplifying the efficiency and depth of security implementations in the future. Explore opportunities, referenced in our insightful article on unparalleled processing speed unleashing the power of quantum computing, to optimally integrate emerging technologies into your RLS strategy. Keeping abreast of innovation ensures preparedness for sustained competitive advantage and exemplary data stewardship.
Monitoring, Optimization, and Ongoing Management of RLS
Row-level security isn’t a one-off implementation—it requires regular monitoring to ensure continued effectiveness and adaptability. Regular audits to assess RLS policies and continuous feedback from users should define routine operational processes. Monitoring helps pinpoint performance bottlenecks, identify security gaps, and verify compliance with evolving regulatory requirements.
Optimization plays a critical role in maintaining responsiveness and accuracy. Leveraging advanced data analytics techniques—for instance, by upgrading inventory analytics through strategies mentioned in our comprehensive guide on optimizing inventory levels through demand forecasting—can ensure that your RLS implementation constantly aligns with tangible business outcomes, fostering a data-driven organizational culture.
RLS policies inevitably evolve as organizations grow or pivot. Efficient data management processes also involve removing unnecessary data securely and promptly; our insights within removing rows of data from a table in SQL can provide valuable guidance wherever datasets need adjustments. Keeping your data lean, secure, and relevant guarantees faster access times, improved overall database performance, and reduced vulnerabilities or exposures.
The Strategic Advantage of Row-Level Security in Analytics Growth
Implementing row-level security positions your organization to harness data’s full strategic potential safely and responsibly. From isolating confidential information to personalizing analytics initiatives and optimizing operations, RLS functions at the intersection of robust security and innovative analytics growth.
As organizations increasingly utilize cross-platform data integration, services like our guide to sending TikTok data to Google BigQuery using Node.js exemplify how data transformation pipelines demand clear and secure access protocols. Row-level security ensures that the right information reaches the right individuals or automated processes at precisely the right time—maximally secure and minimally intrusive.
In the future landscape of accelerated digital transformation, sophisticated analytics, and increasingly stringent data security guidelines, strategic implementation of row-level security within your data transformation workflows is not just advisable—it quickly becomes an absolute necessity. For organizations maintaining forward momentum, adopting strategically planned RLS frameworks ensures you’re ready not just for today’s challenges but tomorrow’s opportunities as well.
Tags: Row-level Security, Data Security, Data Transformation, PostgreSQL, Data Analytics Strategy, Data Governance
In the fast-paced world of data analytics, decision-makers face an ever-growing challenge: extracting actionable insights quickly and efficiently from expanding datasets. As data volumes balloon, traditional query methods can swiftly strain system resources, degrade performance, and inflate both cost and complexity. That’s precisely where the tactical optimization strategy known as projection pushdown comes into play. This powerful optimization is a secret weapon for unlocking efficiency and performance gains by intelligently controlling data retrieval at its most granular level—projecting and selecting only the essential columns and fields needed for a given analysis. With insightful strategies and strategic implementations, projection pushdown not only optimizes query speeds but also significantly reduces data processing overhead. Forward-thinking organizations increasingly embrace advanced optimizations as part of their data architectures, recognizing a clear competitive advantage in managing massive datasets swiftly and effectively. Let’s dive deeper to explore how projection pushdown optimization can systematically revolutionize your data access patterns.
Understanding Projection Pushdown and Why It Matters
Projection pushdown is a query processing optimization technique that filters out unnecessary data at the earliest possible stage of data retrieval. Traditionally, when a data query executes, database engines may pull entire records from storage—even if just a fraction of that information is needed by the end-user. Projection pushdown rectifies this inefficiency, instructing the query engine to read only the necessary columns or attributes from a dataset, ignoring additional fields that have no impact on the resulting analysis or report. This selective approach conserves precious computational resources, reduces input-output overhead, and notably improves query response times.
The significance of projection pushdown spans all domains of professional data analytics—from speeding up daily reporting tasks to powering advanced analyses of ephemeral, high-performance computation workloads. Enhancing efficiency through targeted column selection deeply aligns with contemporary strategies such as those discussed in our exploration of ephemeral computing for burst analytics workloads. By embracing optimizations focused on rapid, selective data retrieval, you can inherently maximize data throughput, minimize latency, and create a smooth, performant analytical ecosystem without the heavy lifting traditionally associated with data processing.
For organizations adopting complex databases such as PostgreSQL, having an optimized database environment can drastically improve system responsiveness and scalability. Professional platforms and databases benefit tremendously from these optimization techniques, and expert advice can streamline this process. Companies seeking deeper PostgreSQL performance insights, custom optimization techniques, or detailed analysis should consider specialized PostgreSQL Consulting Services to rapidly and proficiently leverage projection pushdown capabilities fully.
The Mechanics Behind Projection Pushdown Optimization
Delving deeper into the operation of projection pushdown optimization, it functions by integrating directly alongside database query planners and query execution engines. When a query is dispatched, the optimization process triggers an early data scan stage that assesses the requested columns and fields explicitly. At this point, the optimization significantly reduces I/O and network transfers between the database and the analytic layer by discarding unneeded datasets beforehand rather than later-stage filtering. The difference this makes in real-world scenarios can be substantial, particularly for queries running against expansive warehouse environments or cloud storage systems.
Mechanically, wherever the dataset resides—be it conventional data warehouse columns, Hadoop structures, NoSQL databases, or modern data lakes – projection pushdown identifies and selects required columns early during query processing. By incorporating this targeted extraction into your existing analytics ecosystem, you minimize the yet-to-be-processed datasets significantly—a particularly effective advantage for organizations working with massive, messy datasets requiring specialized ETL processes to clean and transform data.
Besides reducing data size early on, projection pushdown algorithms smartly interact with high-performance Node.js applications that often feed analytics engines. Understanding the mechanics, especially in asynchronous environments, optimizes resource use even further. When you’re building analytics pipelines leveraging Node.js for high-throughput, real-time analysis—such as when you send TikTok data to Google BigQuery using Node.js—projection pushdown can become a crucial component in maintaining smooth performance and reducing latency.
Deployment Considerations and Best Practices
Before diving head-first into deployment, consider practical insights regarding effective implementation. Projection pushdown thrives in structured data environments optimized with clearly defined schema and column-level accessibility. It works exceedingly well with SQL databases, column-oriented data stores, and robust modern data warehousing solutions. Planning data access strategies intentionally, creating carefully sculpted queries incorporating projection pushdown, and aligning technical teams around data structure standardization are vital for success.
An optimized implementation strategy, especially within enterprise environments, typically involves thoughtful architecture and development methodologies, including specialized architecture patterns such as the hexagonal architecture for data platforms using ports and adapters. This pattern neatly aligns business logic with structured, efficient database access strategies like projection pushdown, further clarifying the roles and boundaries within the data processing layer.
Best practices also include ongoing query reviews and metadata examination to ensure unnecessary columns do not populate your analysis—further optimizing query performance and reducing memory consumption. Incorporating automated tools to audit and validate your projection pushdown strategy continuously helps maintain efficiency and provides insightful analytics about data usage patterns, critical for long-term sustainable data management.
Benefits of Strategic Implementation of Projection Pushdown
Effectively embedding projection pushdown optimization in an analytical strategy dramatically enhances operational efficiency and resource utilization. Beneficial impacts cascade across multiple dimensions meaningful to decision-makers—time-to-query improvement, hardware usage reduction, cloud resource cost optimization, and simpler maintenance strategies. Advanced optimization translates directly into measurable business benefits: namely, swift analytics output, quicker data-backed decision-making cycles, reduced cloud expenditure, and streamlined database maintenance.
Moreover, businesses employing sophisticated analytical stacks or edge-computing resources will find projection pushdown especially strategic. When orchestrating computations in modern development environments, mastery of advanced optimizations can significantly enhance overall system efficiency. For example, improved resource allocation and reduction in processing overhead become even more critical for CTOs, data engineers, and analytics directors responsible for managing modern computation stacks featuring single-threaded processes. Insight into execution performance details, as explored in our detailed exploration of Node.js single processor execution and asynchronous superpowers, pairs exceptionally well when leveraging projection pushdown techniques to refine data processing workflows further.
Overcoming Potential Challenges and Roadblocks
Every fruitful technological implementation can face hurdles, and proactively managing these challenges can help ensure seamless adoption of projection pushdown optimization. The primary shortfall seen with projection pushdown implementations involves poor communication or misunderstanding across technical teams about utilizing projection optimization effectively when building queries. Training initiatives and clear guidelines around schema structure, as well as customer-centric communication, ensure that everyone involved—from the engineers to analysts—have a comprehensive understanding of why and how projection pushdown functions best.
Organizations looking to bolster their teams or ensure proficient collaboration while adopting advanced optimizations might additionally benefit from hiring engineers focused on improving data environments. Specialized technical engineers collaborate effectively across departments to ensure implementation effectiveness, drive issue resolution, enhance optimization techniques, and continuously build knowledge assets around projection pushdown practices.
Conquering these roadblocks is feasible through enlightened architecture approaches that clearly elucidate where and how projection pushdown fits best—ultimately freeing your data infrastructure to shine optimally. It positions your analytics environment proactively, preparing it for scalability and efficient data utilization even as workload complexity and data volumes grow.
Conclusion: Elevate Your Data Strategy with Projection Pushdown
With data fast becoming the currency of competitive business success, organizations must adopt strategic, nuanced approaches to ensure efficiency and scalability in analytics operations. Projection pushdown optimization directly contributes to this strategic vision by intelligently streamlining analytics operations and introducing unrivaled performance capabilities. Enhance your analytics maneuverability, economize cloud and infrastructure resource usage, simplify data management procedures, and ensure swift, accurate insights through thoughtfully applied optimizations.
Embracing advanced query-managed strategies like projection pushdown prepares your organization for tomorrow’s data-driven challenges, providing an analytics-driven competitive edge. As you progress down your data strategy journey, let insightful implementation of projection pushdown optimization act as your trusted edge, providing tightly coupled business performance and data strategy alignment structured intelligently and intentionally.
Tags: Projection Pushdown Optimization, Data Access Patterns, Query Performance, PostgreSQL Consulting, Column-based Analytics, Data Strategy