
In our data-driven world, understanding the characteristics of complex datasets is critical to driving impactful business decisions. Capturing insights from multivariate distributions efficiently often requires intuitive and powerful visual tools that reveal underlying trends and correlations instantly.
Density contour visualizations are advanced graphical representations enabling analysts and strategists to delve deeper, capturing relations between multiple variables in accessible graphical formats. Organizations leveraging sophisticated analytics methods—including visualizations like density contours—gain substantial strategic advantages. With the capability to visualize multiple dimensions simultaneously, executives, decision-makers, and technical teams forge ahead, making evidence-based, insightful decisions confidently.
Why Use Density Contour Visualization?
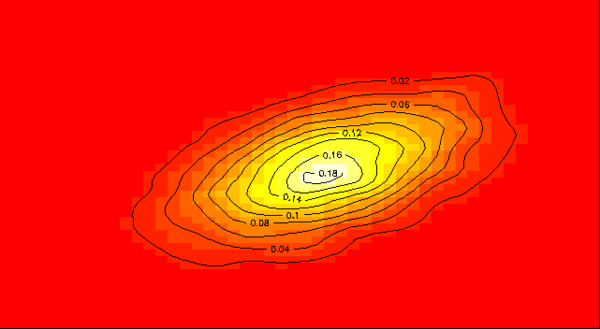
At the intersection of analytics and decision-making stands density contour visualization. From complex datasets with numerous variables to dynamic real-time data streams, professionals continually face challenges requiring accurate, interpretable representations. Density contour visualizations illustrate regions of varying concentration within a dataset, thereby simplifying the intricate relationship patterns usually masked in traditional charts or tables. The dynamic contours allow users to easily discern high-density clusters, outliers, and complex relationships among variables which are particularly valuable in fields such as finance, healthcare, marketing analytics, and multivariate statistical analysis.
Compared against conventional visualization like scatter plots or simple heatmaps, density contours offer clearer visual delineation of distribution and probability densities in multi-dimensional data. Decision-makers gain practical insights efficiently, enabling them to strategically allocate resources to critical areas of concentration within datasets. Organizations investing in robust analytical capabilities, including advanced visualization methods, distinctly position themselves for competitive advantage. Where traditional statistical methods fall short, density contours become a crucial step forward, distinctly enhancing exploratory data analysis, especially useful during early stages of innovation-led projects.
Understanding Multivariate Distributions with Contours
Multivariate distributions involve numerous variables that exhibit correlations and dependencies, demanding a robust analytical approach to comprehend thoroughly. Conventional methods often struggle to clearly articulate multidimensional distributions, leading to potentially costly misinterpretations.
Density contours step comfortably into this analytical gap. They effectively display data density by grouping observations into contours, a feature particularly useful when exploring relationships between multiple variables. For instance, marketing analytics practitioners frequently utilize density contour plots to distinguish distinct consumer segments based on multiple behavior attributes simultaneously. Visualization thus leads directly to actionable insights crucial for strategic business decision-making.
Analytic expertise entails grasping underlying statistical foundations, such as understanding covariance structures among multiple data distributions. To strengthen foundational knowledge, reading articles like Mastering SQL Syntax or exploring contrasts such as understanding PostgreSQL versus SQL Server boosts database proficiency, facilitating smoother integration and querying of multivariate datasets for visualization. Such knowledge significantly empowers analysts, enabling sophisticated interpretations crucial for strategic advantage throughout innovative enterprise environments.
The Technical Foundations of Density Contour Visualization
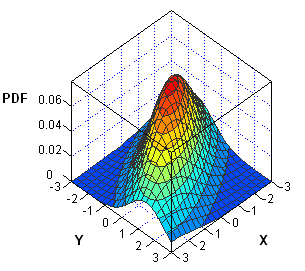
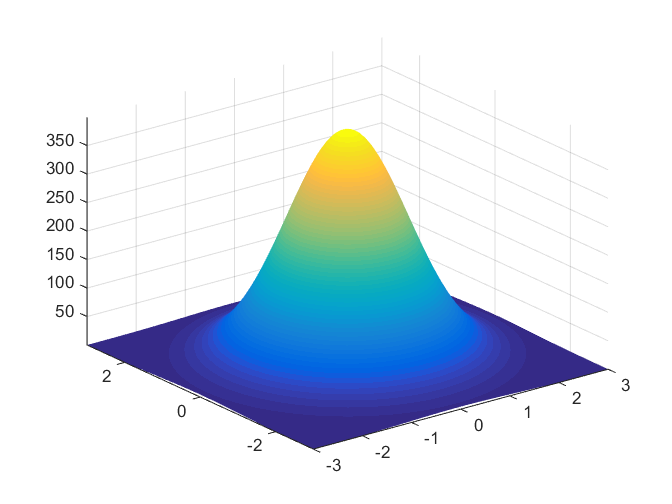
Density contours essentially translate complex mathematical and statistical formulations—kernel density estimation, probability distributions, statistical inference methods—into visually intuitive representations. At its core, a density contour plot represents a graphical rendering of a probability density function, richly providing analyst-friendly interpretations of variance and covariance across multiple continuous variables.
Kernel density estimation (KDE), a non-parametric way to estimate probability density functions, provides the algorithmic baseline. KDE smooths datasets, turning granular complexity into insightful depictions of concentration regions within data. The resulting visualization distinctly marks areas of highest and lowest densities through clear contour lines, simplifying much of the complex interpretation inherent in analytical explorations. Graphically linking data diagnostics, feature engineering choices, and business-focused analyses give decision-makers actionable leverage.
Proficiency in advanced analytics and effective visualizations broadly aligns with ongoing trends in interactive data analytics and technology innovation. Leveraging advanced visualization harmonizes with best practices in data engineering and analytics, as described effectively in the article on overrated modern data engineering tools. Critical understanding of statistical backgrounds behind these visualizations ensures data scientists, analysts, and technical leaders sustain capable data maneuverability throughout rigorous analytics implementations.
Interactive Visualizations Enhance Insight Discovery
Interactivity transforms static density contour visualizations into potent exploratory tools. Animated transitions such as those discussed in our article Animated Transitions in Interactive Data Visualizations enable analysts and executives to understand how data relationships evolve dynamically across multiple configurations. The ability to swiftly adjust parameters—such as variables selected, kernel bandwidths, or visualization granularity—facilitates critical explorations, significantly enhancing the discovery process. Interactive contours thus evolve from static representations into agile insights machines, effortlessly empowering innovation and real-time strategic scenario analysis.
Decision-makers frequently demand rapid iterations and dynamic data assessments, emphasizing the need for dynamically allocated analytical workloads. Utilizing techniques like dynamic resource allocation for pipeline workloads ensures rapid and optimized responses to real-time visualization demands, seamlessly linking analytics infrastructure strategies with visualization-driven insights.
Data discovery approaches, including approximate query processing for interactive explorations, further strengthen interactive visual advantages, frontrunning strategic initiatives in rapidly scaling, innovation-centric corporate environments.
Implementing Density Contour Visualization with Industry Tools
Established visualization and analytics tools—ranging from open-source platforms like R, Python’s seaborn or matplotlib libraries, to enterprise tools such as Tableau—readily enable density contour implementations. Establishing intelligent indexing during data preparation in specific analytics platforms proves particularly beneficial for enhancing performance, as explained in our guide on indexing in SQL. Using these professional insights enhances visualization analytics processing speeds, optimally preparing data for smooth visual interpretations.
Incorporating density contour visualizations into business workflows aligns with broader strategic analytical initiatives. For instance, crafting density plots alongside advanced pipeline strategies, such as those described in pipeline execution planning, complements robust data analytics pipelines that can scale rapidly in cloud environments. Additionally, with increased adoption arising from migrating analytics environments toward cloud solutions such as Microsoft Azure, partnering with expert services like Azure Consulting Services guarantees optimized integration and deployment of cutting-edge visual analytics environments.
Whether deploying visual analytics capabilities internally or using existing packaged solutions like Dev3lop’s new analytics dashboards—such as the Colibri Google Analytics Tableau Dashboard—effective enterprise adoption of density contours underscores innovation-led analytical competitiveness.
Practical Considerations & Usage Examples
Density contours serve diverse analytical challenges in practice. Health organizations use density contours to identify disease spread patterns across demographics, informing effective interventions swiftly. Financial analysts depict investment portfolio risks and returns clearly, illustrating covariance among asset returns through insightful visual plots.
An essential component lies in awareness of analytical data differences, such as clearly distinguishing between SQL operations such as UNION versus UNION ALL. Awareness and technical knowledge encourage efficient, hazard-free manipulation of datasets, importantly aiding accurate visual insights.
Additionally, density contours simplify exploratory analyses of customer purchasing patterns, especially useful for analytics marketing campaigns, market segmentation, customer acquisition strategies, and predictive customer churn analyses. Ultimately, density contours provide invaluable strategic orientations, ensuring empowered decision-making across interdisciplinary technological disciplines, establishing capacity for sustained analytics innovation.
Thank you for your support, follow DEV3LOPCOM, LLC on LinkedIn and YouTube.


