Uncomplicate Data
Create end-to-end data analytics solutions in one app that is simple to use, and self-explanatory.
About ET1
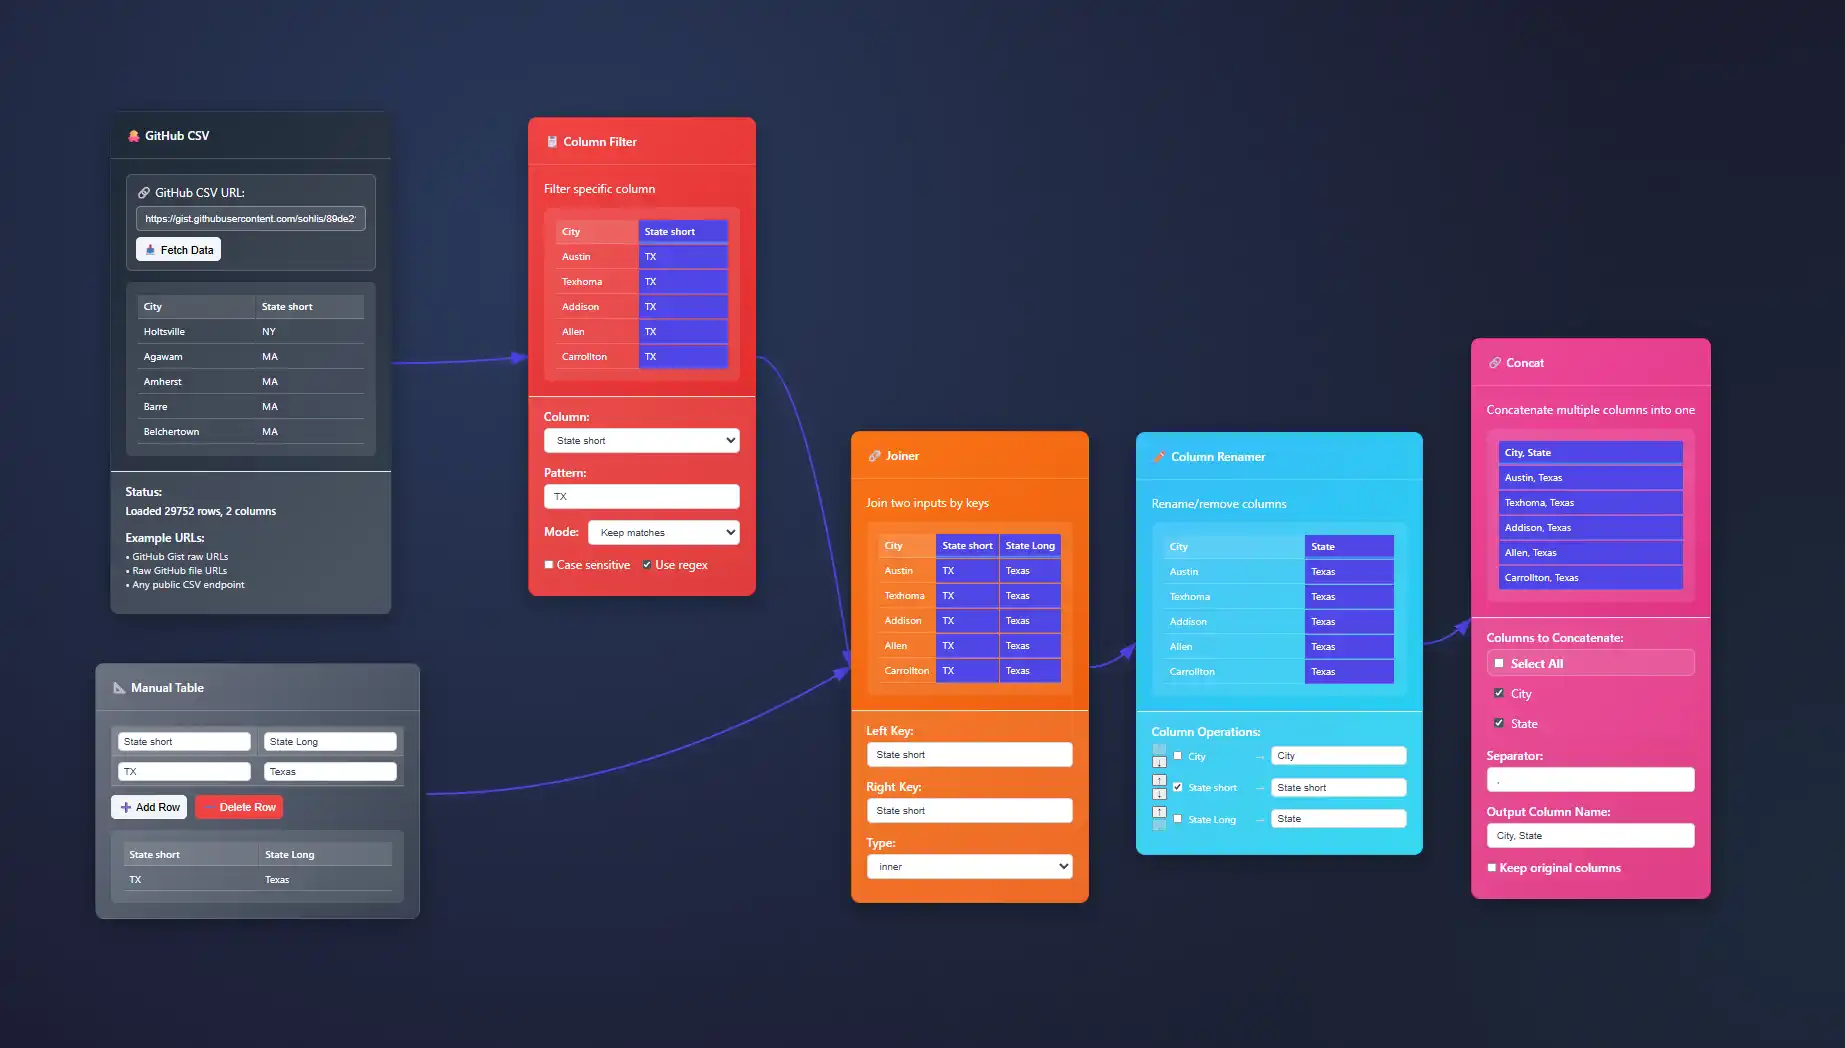
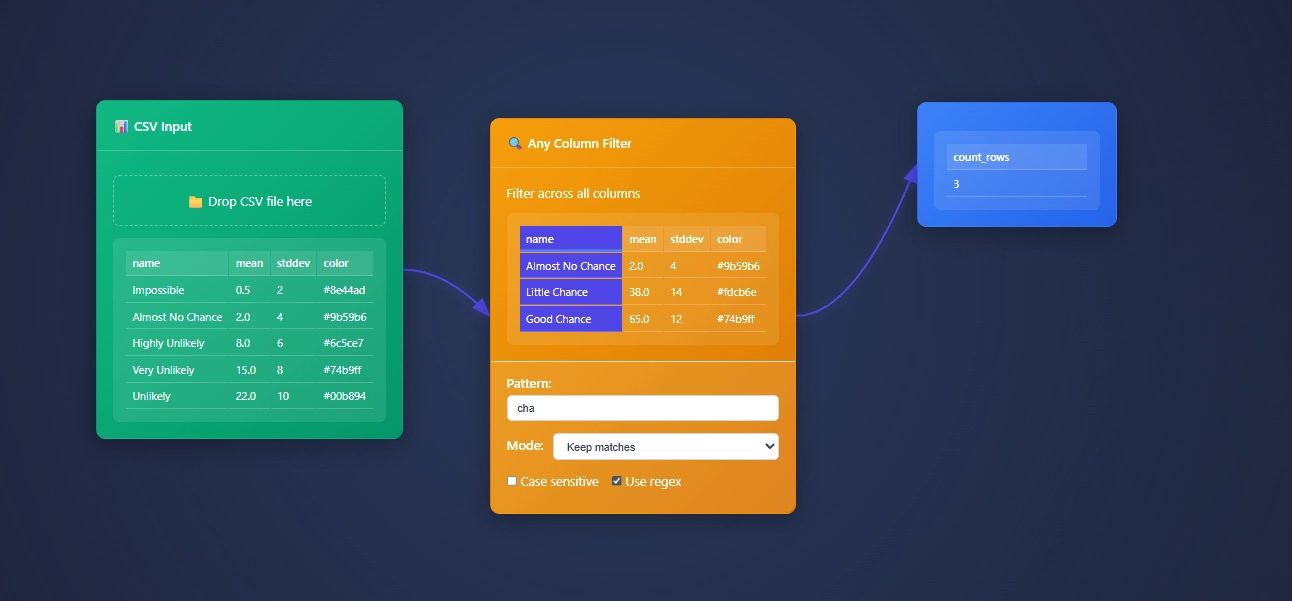
ET1 is a visual data workbench that lets you explore, clean, and explain data solutions.


- Access ET1
- Unlock 24 nodes
- Free ETL software
- Desktop friendly
- Code on GitHub iCore utilities, UI pieces, and node definitions live in the public repository so you can review how processing works.
- No storage
- ET1.1 + GitHub OAuth
- Unlock 29 nodes
- Workflows + Neon LakeiNeon Lake is the persistent store for workflow data and results. The free tier has no storage. This tier includes limited storage and 1 branch.
- 100/CU-monthiCU = Compute Unit. An internal measure we use to track processing cost across transforms.
- 500 MB storageiStorage in Neon Lake for tables and results. Retention policies may apply while we tune usage.
- 1 BranchiThis tier includes a single branch only.
- ET1.1 + GitHub OAuth
- Unlock 29 nodes
- Workflows + Neon Lake
- $0.28/CU-houriMetered compute beyond included quota. Priced per compute-hour equivalent derived from CU usage.
- $0.46/GB-monthiNeon Lake storage billed by logical GB-month. We may introduce archival tiers.
- 3 BranchesiEach branch has isolated CPU and storage. You only pay for the delta (the difference) between branches.
- SOC 2 • HIPAA • GDPR
- Regional locations
- User-level pricing
- $0.52/CU-hour
- $0.49/GB-month
- 10 Branches
- Unlimited databases & tables
Training Documentation
Use the training material to help you understand more about ET1 and how it helps solve data wrangling problems.

ET1 Basic Training
If you need help getting started, begin here.

ET1 Video Training
Learn the basics, the features, and more.
Future Insight
We see the future being focused on adoption, training, and creating Easy Tools for anyone. We are building an emerging technology while also maintaining a creative user experience that is inviting and friendly for all ages.
Inspiration
We are inspired by software, video games, and Sci-Fi movies like The Matrix, Minority Report and Ironman.
Join beta.
Why do you want to access beta?
Satellite Imagery Analytics: Earth Observation Data Visualization
Ever wondered how strategic business decisions, global policies, or environmental strategies are guided by powerful insights from miles above the Earth's surface? Satellite imagery analytics has swiftly evolved from governmental classified operations to a...
Graph Database Visualization: Relationship Mapping at Enterprise Scale
In today's rapidly evolving digital landscape, enterprises face complex questions that traditional data systems can't effectively answer. Understanding relationships between various elements of your data isn't just helpful—it's essential. Enter graph database...
Energy Grid Visualization: Smart Grid Data Analysis Dashboards
Imagine having complete visibility into your entire energy distribution system, seeing not just numbers and limitations, but actionable insights in real-time—leading to smarter strategies, better decisions, and optimized performance. Smart grid data analysis...
Biometric Data Visualization: Wearable Device Analytics Platforms
Imagine walking into a high-stakes business meeting armed not just with intuition but real-time insights drawn directly from biometric data—instant analytics that literally reflect your physical state. Wearable devices aren't just smart gadgets anymore; they are vital...
Content Performance Analytics: Digital Marketing Visualization Tools
In today's data-driven marketplace, performance counts more than ever—and digital content analytics are the decisive factor in any successful marketing strategy. As digital marketers produce volumes of content across numerous channels, gaps in performance visibility...
Inventory Optimization Visualization: Supply and Demand Balancing
Imagine running a business where every product hits the shelves at precisely the right moment, seamlessly meeting customer demand without excess storage or shortages. Picture your decisions guided by insightful visualizations, based not merely on intuition but...
Fraud Detection Patterns: Financial Crime Visualization Techniques
The battle against financial fraud hinges on swiftly identifying anomalies hidden within massive volumes of transactional data. These anomalies, difficult to detect through traditional data analysis methods, demand innovative and precise visual analytic practices to...
Climate Data Visualization: Environmental Analytics for Decision Makers
In the high-stakes realm of climate change, the ability to translate vast pools of environmental data into actionable intelligence is not merely valuable—it's transformative. Imagine if, instead of looking at dense rows of temperature figures, carbon emissions, or...
Workforce Analytics Dashboards: HR Data-Driven Decision Making
The future of human resource management lies firmly in harnessing the strategic advantage of workforce analytics dashboards. Imagine being equipped with powerful insights that not only accurately reflect current workforce dynamics but also empower proactive...
Features of Today()+1
Available Now()


