Uncomplicate Data
Create end-to-end data analytics solutions in one app that is simple to use, and self-explanatory.
About ET1
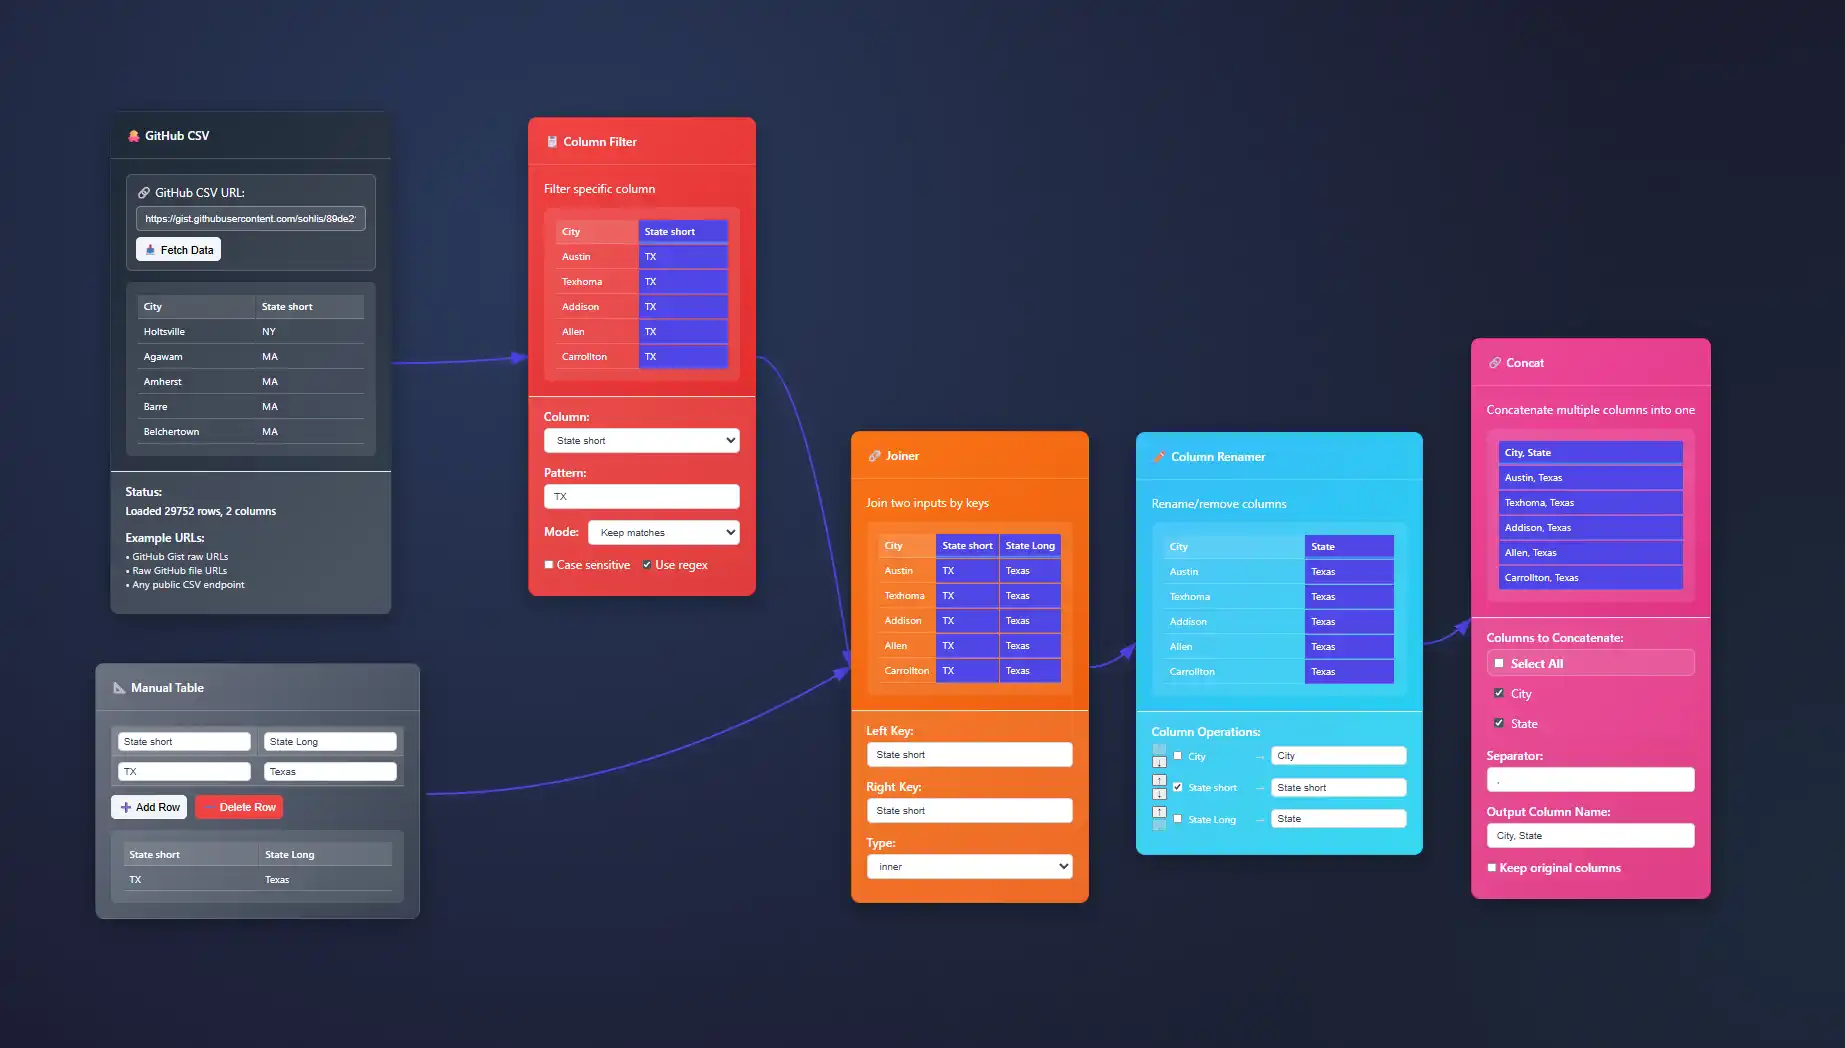
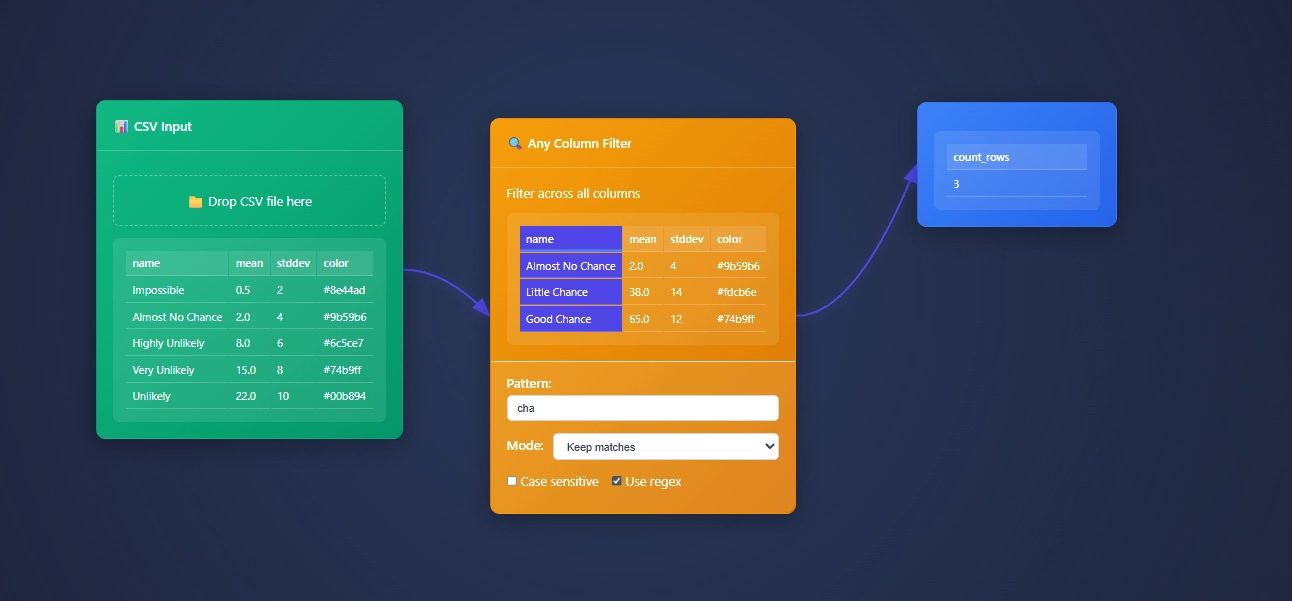
ET1 is a visual data workbench that lets you explore, clean, and explain data solutions.


- Access ET1
- Unlock 24 nodes
- Free ETL software
- Desktop friendly
- Code on GitHub iCore utilities, UI pieces, and node definitions live in the public repository so you can review how processing works.
- No storage
- ET1.1 + GitHub OAuth
- Unlock 29 nodes
- Workflows + Neon LakeiNeon Lake is the persistent store for workflow data and results. The free tier has no storage. This tier includes limited storage and 1 branch.
- 100/CU-monthiCU = Compute Unit. An internal measure we use to track processing cost across transforms.
- 500 MB storageiStorage in Neon Lake for tables and results. Retention policies may apply while we tune usage.
- 1 BranchiThis tier includes a single branch only.
- ET1.1 + GitHub OAuth
- Unlock 29 nodes
- Workflows + Neon Lake
- $0.28/CU-houriMetered compute beyond included quota. Priced per compute-hour equivalent derived from CU usage.
- $0.46/GB-monthiNeon Lake storage billed by logical GB-month. We may introduce archival tiers.
- 3 BranchesiEach branch has isolated CPU and storage. You only pay for the delta (the difference) between branches.
- SOC 2 • HIPAA • GDPR
- Regional locations
- User-level pricing
- $0.52/CU-hour
- $0.49/GB-month
- 10 Branches
- Unlimited databases & tables
Training Documentation
Use the training material to help you understand more about ET1 and how it helps solve data wrangling problems.

ET1 Basic Training
If you need help getting started, begin here.

ET1 Video Training
Learn the basics, the features, and more.
Future Insight
We see the future being focused on adoption, training, and creating Easy Tools for anyone. We are building an emerging technology while also maintaining a creative user experience that is inviting and friendly for all ages.
Inspiration
We are inspired by software, video games, and Sci-Fi movies like The Matrix, Minority Report and Ironman.
Join beta.
Why do you want to access beta?
Cybersecurity Threat Maps: Real-Time Attack Visualization
Imagine witnessing the pulse of cyber threats across the globe with absolute clarity; seeing digital attacks streaming in real-time, visualized and mapped like a radar revealing storm clouds before they burst. For modern executives and tech strategists, cybersecurity...
ESG Reporting Dashboards: Sustainability Metrics That Matter
In an era where transparency and meaningful insights reign supreme, Environmental, Social, and Governance (ESG) reporting dashboards have emerged as a transformative tool. ESG reporting isn't a passing trend—it's a reflection of conscientious business decisions,...
Omnichannel Customer Analytics: Unified Journey Visualization
In today's fast-paced, digitally connected world, businesses operate across multiple channels, from websites and social media to point-of-sale systems, mobile apps, and customer support platforms. This complexity has given rise to omnichannel customer interactions and...
Digital Twin Visualization: Mirroring Physical Assets in Data
Imagine managing a physical manufacturing plant and simultaneously interacting with its exact digital replica from anywhere in the world—predicting outcomes, enhancing efficiencies, and optimizing performance in real-time. This isn't science fiction; it's Digital Twin...
Anomaly Detection Visualization: Spotting Outliers in Big Data
In today's era of explosive data growth, understanding the clues hidden within immense volumes of information has become crucial. Anomalies—those unexpected patterns or outliers—concealed within big datasets not only distort insights but also create critical...
Regulatory Compliance Dashboards: Automated Risk Assessment
In today's rapidly transforming digital landscape, navigating regulatory compliance is no longer a matter of manual checklists and static reports. Businesses require dynamic, intuitive, and automated analytics solutions that not only streamline compliance efforts but...
Market Microstructure Visualization: High-Frequency Trading Patterns
In today's financial markets, milliseconds can mean millions of dollars. High-Frequency Trading (HFT) leverages complex algorithms, fast data processing, and cutting-edge visualization techniques to gain a competitive edge. From exchanges to hedge funds, understanding...
Epidemiological Data Mapping: Public Health Visualization Strategies
In today's fast-moving landscape of global health, the ability to rapidly visualize, interpret, and act on epidemiological data makes the difference between proactive mitigation and crisis response. Modern public health challenges require more than vast databases and...
Recommendation Engine Visualization: Understanding Algorithm Decisions
Imagine being able to break down the mysterious "black box" of recommendation algorithms into intuitive visuals that everyone can grasp. Businesses routinely rely on recommendation engines to personalize user experiences, increase engagement, and drive revenue...
Features of Today()+1
Available Now()


