Uncomplicate Data
Create end-to-end data analytics solutions in one app that is simple to use, and self-explanatory.
About ET1
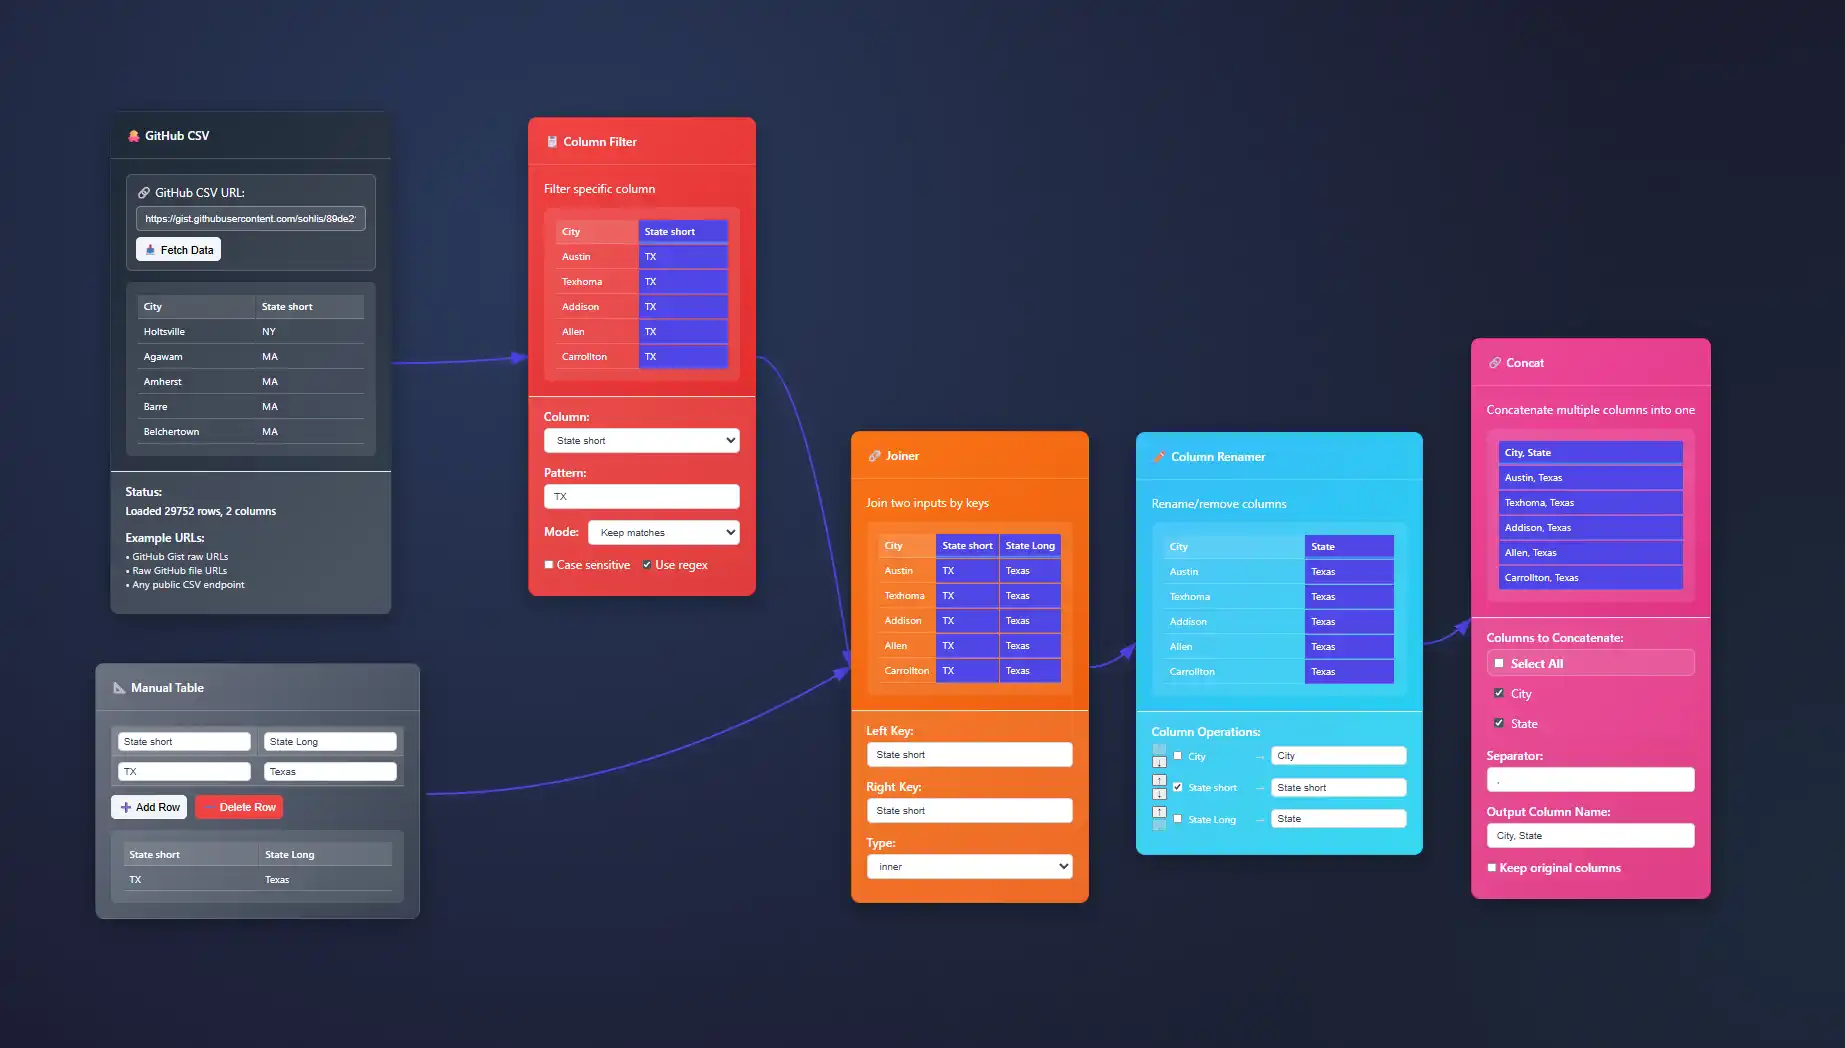
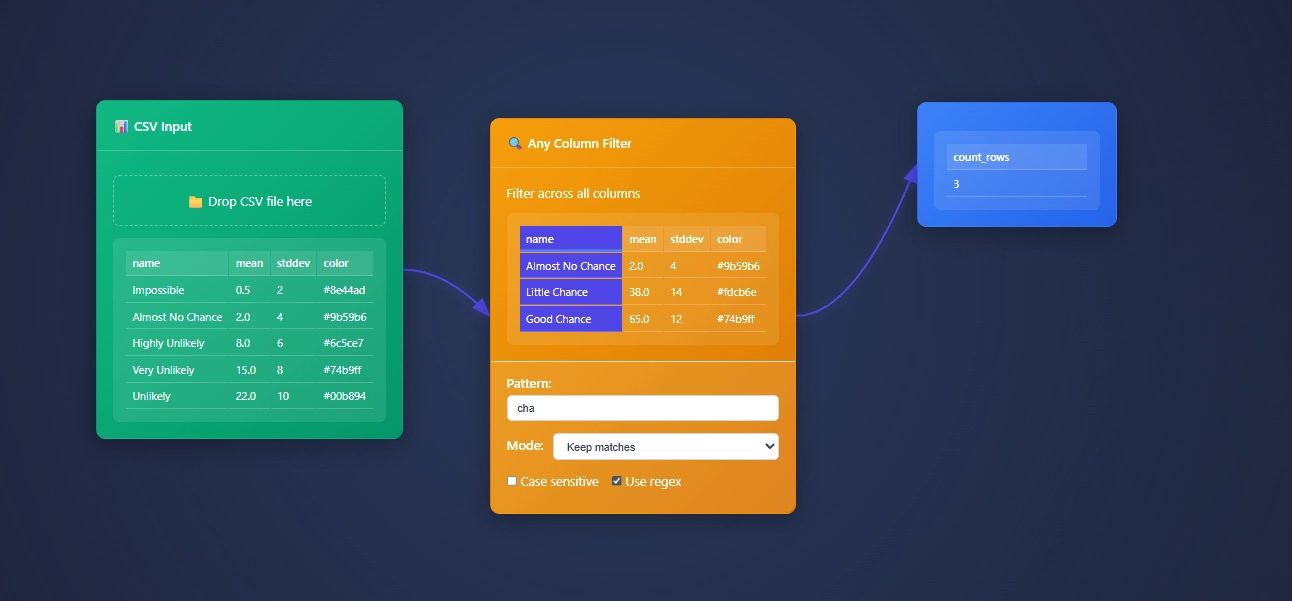
ET1 is a visual data workbench that lets you explore, clean, and explain data solutions.


- Access ET1
- Unlock 24 nodes
- Free ETL software
- Desktop friendly
- Code on GitHub iCore utilities, UI pieces, and node definitions live in the public repository so you can review how processing works.
- No storage
- ET1.1 + GitHub OAuth
- Unlock 29 nodes
- Workflows + Neon LakeiNeon Lake is the persistent store for workflow data and results. The free tier has no storage. This tier includes limited storage and 1 branch.
- 100/CU-monthiCU = Compute Unit. An internal measure we use to track processing cost across transforms.
- 500 MB storageiStorage in Neon Lake for tables and results. Retention policies may apply while we tune usage.
- 1 BranchiThis tier includes a single branch only.
- ET1.1 + GitHub OAuth
- Unlock 29 nodes
- Workflows + Neon Lake
- $0.28/CU-houriMetered compute beyond included quota. Priced per compute-hour equivalent derived from CU usage.
- $0.46/GB-monthiNeon Lake storage billed by logical GB-month. We may introduce archival tiers.
- 3 BranchesiEach branch has isolated CPU and storage. You only pay for the delta (the difference) between branches.
- SOC 2 • HIPAA • GDPR
- Regional locations
- User-level pricing
- $0.52/CU-hour
- $0.49/GB-month
- 10 Branches
- Unlimited databases & tables
Training Documentation
Use the training material to help you understand more about ET1 and how it helps solve data wrangling problems.

ET1 Basic Training
If you need help getting started, begin here.

ET1 Video Training
Learn the basics, the features, and more.
Future Insight
We see the future being focused on adoption, training, and creating Easy Tools for anyone. We are building an emerging technology while also maintaining a creative user experience that is inviting and friendly for all ages.
Inspiration
We are inspired by software, video games, and Sci-Fi movies like The Matrix, Minority Report and Ironman.
Join beta.
Why do you want to access beta?
Behavioral Analytics Visualization: Understanding User Journey Patterns
In today's digital ecosystem, the ability to visually track and interpret user behaviors is essential for companies aiming to deliver exceptional user experiences. Imagine clearly understanding how your users journey through your product or platform, knowing precisely...
Geospatial Intelligence: Military-Grade Mapping for Business Analytics
In our digital-first world, mapping has evolved from static paper charts to dynamic, interactive geospatial analytics powered by cutting-edge technology. It's no longer sufficient for businesses to simply glance at maps for basic logistics; today’s industry leaders...
Neural Network Architecture Visualization: Demystifying Deep Learning
Imagine peering directly into the "black box" of artificial intelligence, effortlessly dissecting complex deep learning models to reveal transparency and insight. Neural network architecture visualization is exactly this—a method that transforms enigmatic deep...
Supply Chain Transparency: Visualizing End-to-End Product Journeys
In today's competitive landscape, gaining real-time insight into your supply chain operations is no longer merely an advantage—it's essential. Industry leaders and decision-makers increasingly recognize the critical need for supply chain transparency, not just to...
Predictive Maintenance Dashboards: Preventing Equipment Failure
In today's rapidly evolving business landscape, reactive approaches to equipment maintenance are becoming obsolete. Forward-thinking enterprises increasingly leverage analytics-driven predictive maintenance dashboards to gain early insights and proactively mitigate...
Customer Sentiment Heat Maps: Visualizing Social Media Analytics
In an age dominated by real-time feedback and instant interactions, understanding your customer's sentiment becomes pivotal to shaping strategy, enhancing customer experience, and staying ahead of competitors. However, the complexity of today's digital ecosystem can...
Financial Risk Visualization: Monte Carlo Simulation Dashboards
Successful organizations no longer guess when it comes to managing financial risk; they visualize, simulate, and strategize. The ever-changing financial landscape demands precision, insight, and advanced analytics tools. Among these, Monte Carlo Simulation dashboards...
Healthcare Data Privacy: Anonymized Visualization Techniques
In today's data-driven healthcare environment, harnessing intelligence from vast pools of sensitive patient information is pivotal. Yet, these rich insights come with significant privacy responsibilities. Balancing valuable visualization with stringent anonymity...
Quantum Computing Visualization: Representing Superposition States
Quantum computing is no longer just a futuristic buzzword; it's a profound technological leap reshaping how organizations solve complex problems. At the heart of quantum computing is the concept of "superposition" — an ability of quantum bits, or qubits, to be in...
Features of Today()+1
Available Now()


