Uncomplicate Data
Create end-to-end data analytics solutions in one app that is simple to use, and self-explanatory.
About ET1
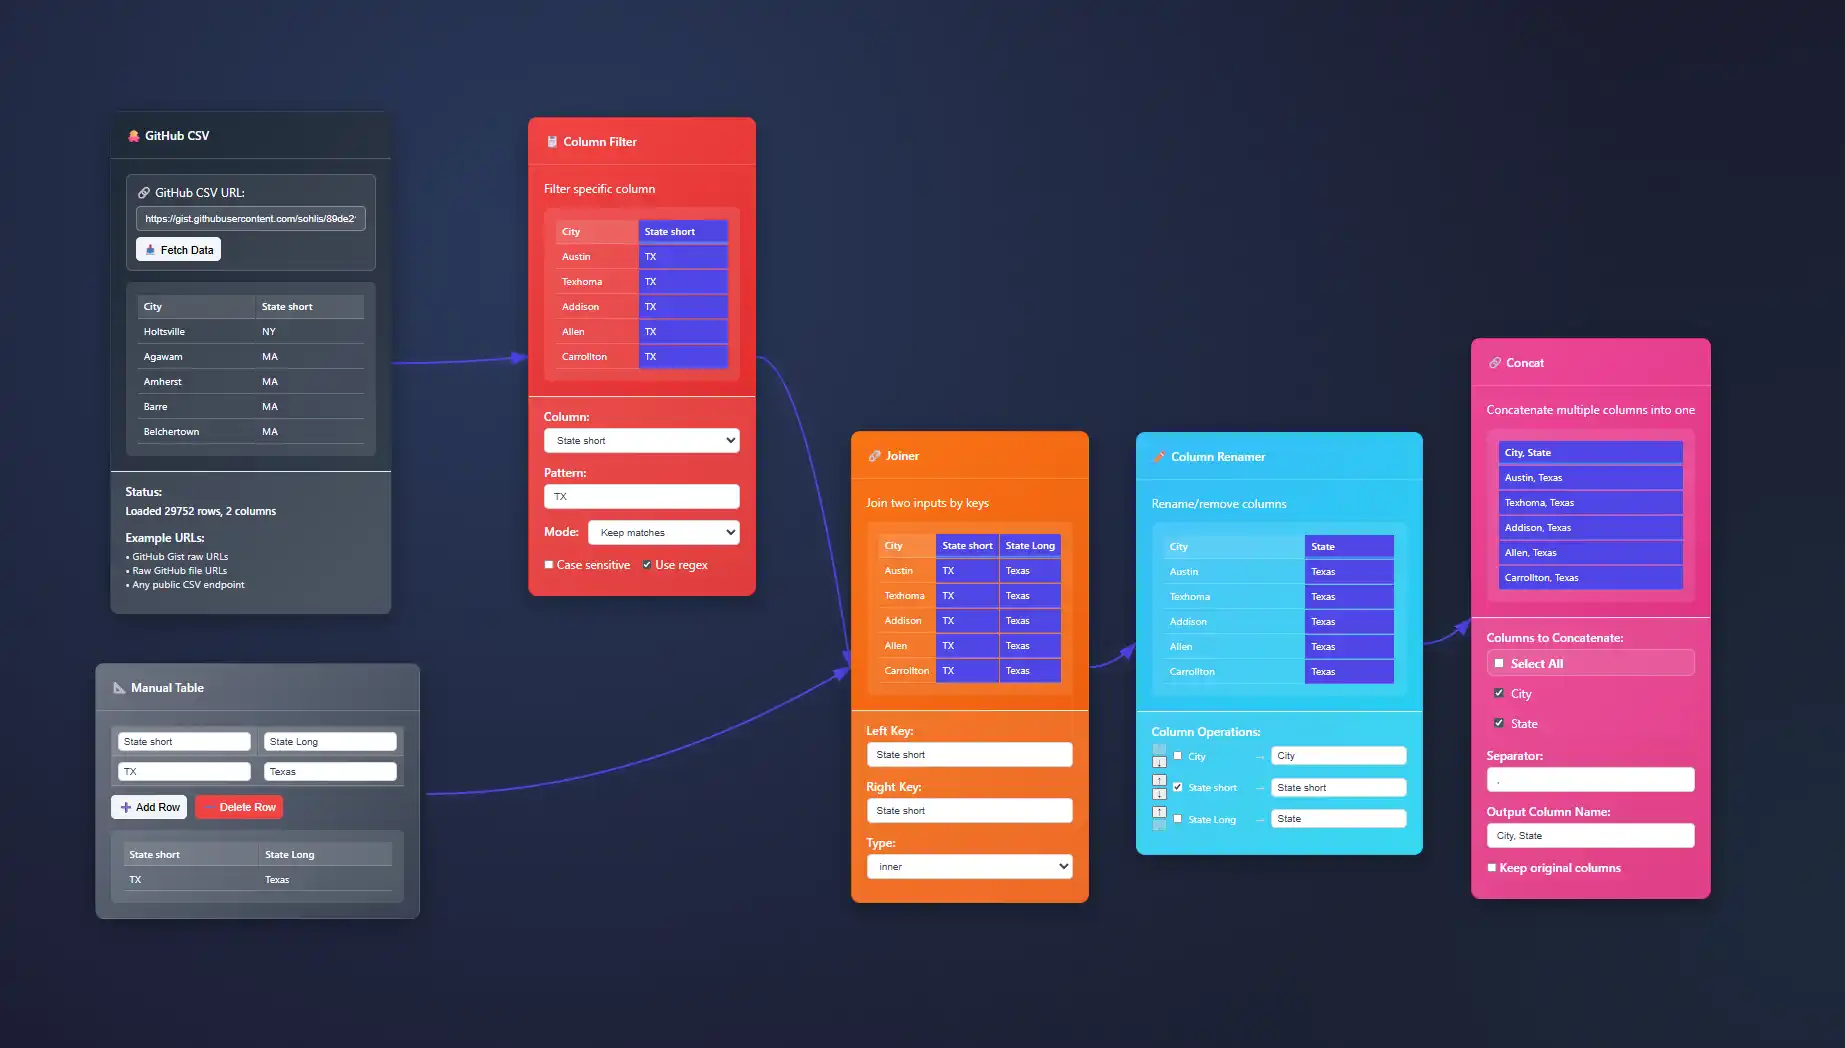
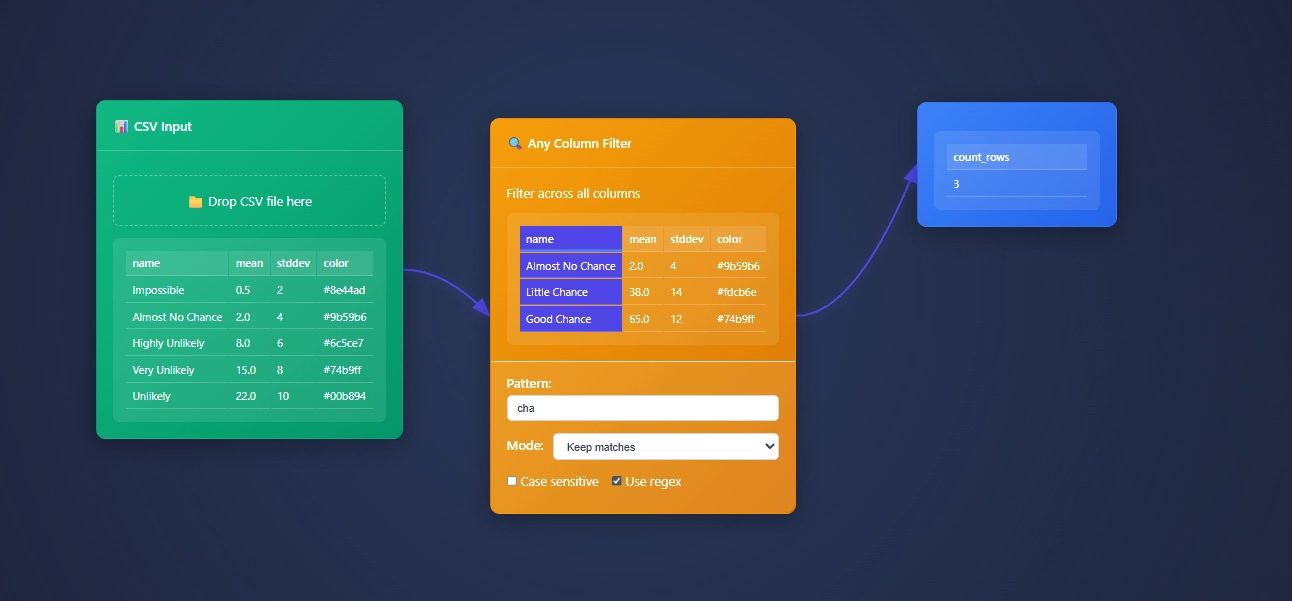
ET1 is a visual data workbench that lets you explore, clean, and explain data solutions.


- Access ET1
- Unlock 24 nodes
- Free ETL software
- Desktop friendly
- Code on GitHub iCore utilities, UI pieces, and node definitions live in the public repository so you can review how processing works.
- No storage
- ET1.1 + GitHub OAuth
- Unlock 29 nodes
- Workflows + Neon LakeiNeon Lake is the persistent store for workflow data and results. The free tier has no storage. This tier includes limited storage and 1 branch.
- 100/CU-monthiCU = Compute Unit. An internal measure we use to track processing cost across transforms.
- 500 MB storageiStorage in Neon Lake for tables and results. Retention policies may apply while we tune usage.
- 1 BranchiThis tier includes a single branch only.
- ET1.1 + GitHub OAuth
- Unlock 29 nodes
- Workflows + Neon Lake
- $0.28/CU-houriMetered compute beyond included quota. Priced per compute-hour equivalent derived from CU usage.
- $0.46/GB-monthiNeon Lake storage billed by logical GB-month. We may introduce archival tiers.
- 3 BranchesiEach branch has isolated CPU and storage. You only pay for the delta (the difference) between branches.
- SOC 2 • HIPAA • GDPR
- Regional locations
- User-level pricing
- $0.52/CU-hour
- $0.49/GB-month
- 10 Branches
- Unlimited databases & tables
Training Documentation
Use the training material to help you understand more about ET1 and how it helps solve data wrangling problems.

ET1 Basic Training
If you need help getting started, begin here.

ET1 Video Training
Learn the basics, the features, and more.
Future Insight
We see the future being focused on adoption, training, and creating Easy Tools for anyone. We are building an emerging technology while also maintaining a creative user experience that is inviting and friendly for all ages.
Inspiration
We are inspired by software, video games, and Sci-Fi movies like The Matrix, Minority Report and Ironman.
Join beta.
Why do you want to access beta?
Ultra-Low-Latency Stream Ingestion Pipeline Design
In a digital landscape where milliseconds make the difference between a delightful user experience and a catastrophic system failure, designing for ultra-low-latency in stream ingestion pipelines is no longer optional—it's a strategic necessity. At Dev3lop LLC, we...
Machine Learning Model Interpretability Through Advanced Visualization
YIn today's rapidly evolving era of artificial intelligence, businesses evolve at the pace their data flows. Machine learning (ML) models unlock unprecedented opportunities for innovation and growth. Yet their black-box nature often leaves executives and stakeholders...
Voice-Activated Data Exploration: The Future of Hands-Free Analytics
Imagine analyzing massive data landscapes with just the power of your voice, commanding advanced analytical processes to deliver insights instantly, intuitively, and seamlessly. Voice-activated data exploration is no longer a futuristic fantasy—it's rapidly becoming...
Augmented Reality Dashboards: Overlaying Data on Physical Operations
Imagine standing on a bustling factory floor, peering through your AR goggles and instantly seeing vital production data floating seamlessly next to each machine. Glancing at a warehouse aisle, you effortlessly access real-time inventory status hovering right...
Blockchain Transaction Visualization: Mapping Distributed Ledger Activity
Imagine visualizing the invisible, tracing the paths of transactions that ripple across global networks instantly and securely. Blockchain transaction visualization unlocks this capability, transforming abstract data flows into clear, navigable visual stories....
Time Series Forecasting Visualization: Making Predictions Understandable
Predicting future trends has long captivated human imagination—from ancient astronomers mapping celestial paths to today's financial experts forecasting markets. Yet, while accurate time series forecasting is critical, communicating these predictions comprehensively...
Cultural Data Design: Adapting Visualizations for Global Audiences
In today's interconnected world, data visualization is more than just graphs, charts, and dashboards—it's a universal language that bridges barriers and communicates complex insights across diverse cultural audiences. If your visualizations aren't culturally attuned,...
IoT Sensor Data Streams: Real-Time Visualization Architecture Patterns
Imagine harnessing streams of data generated continuously from millions of IoT sensors spread across cities, factories, farms, and even personal devices, and instantly visualizing this information in powerful, actionable dashboards. To realize this vision and fully...
Data Lake Visualization: Making Sense of Unstructured Information
Imagine navigating through a vast, dense forest without a map or compass—sounds daunting, doesn't it? That's exactly how many businesses view their expansive data lakes. Overflowing with unstructured and diverse data types, extracting meaningful insights feels akin to...
Features of Today()+1
Available Now()


