Uncomplicate Data
ET1, for humans who hate complex
No ET phone home.
About ET1
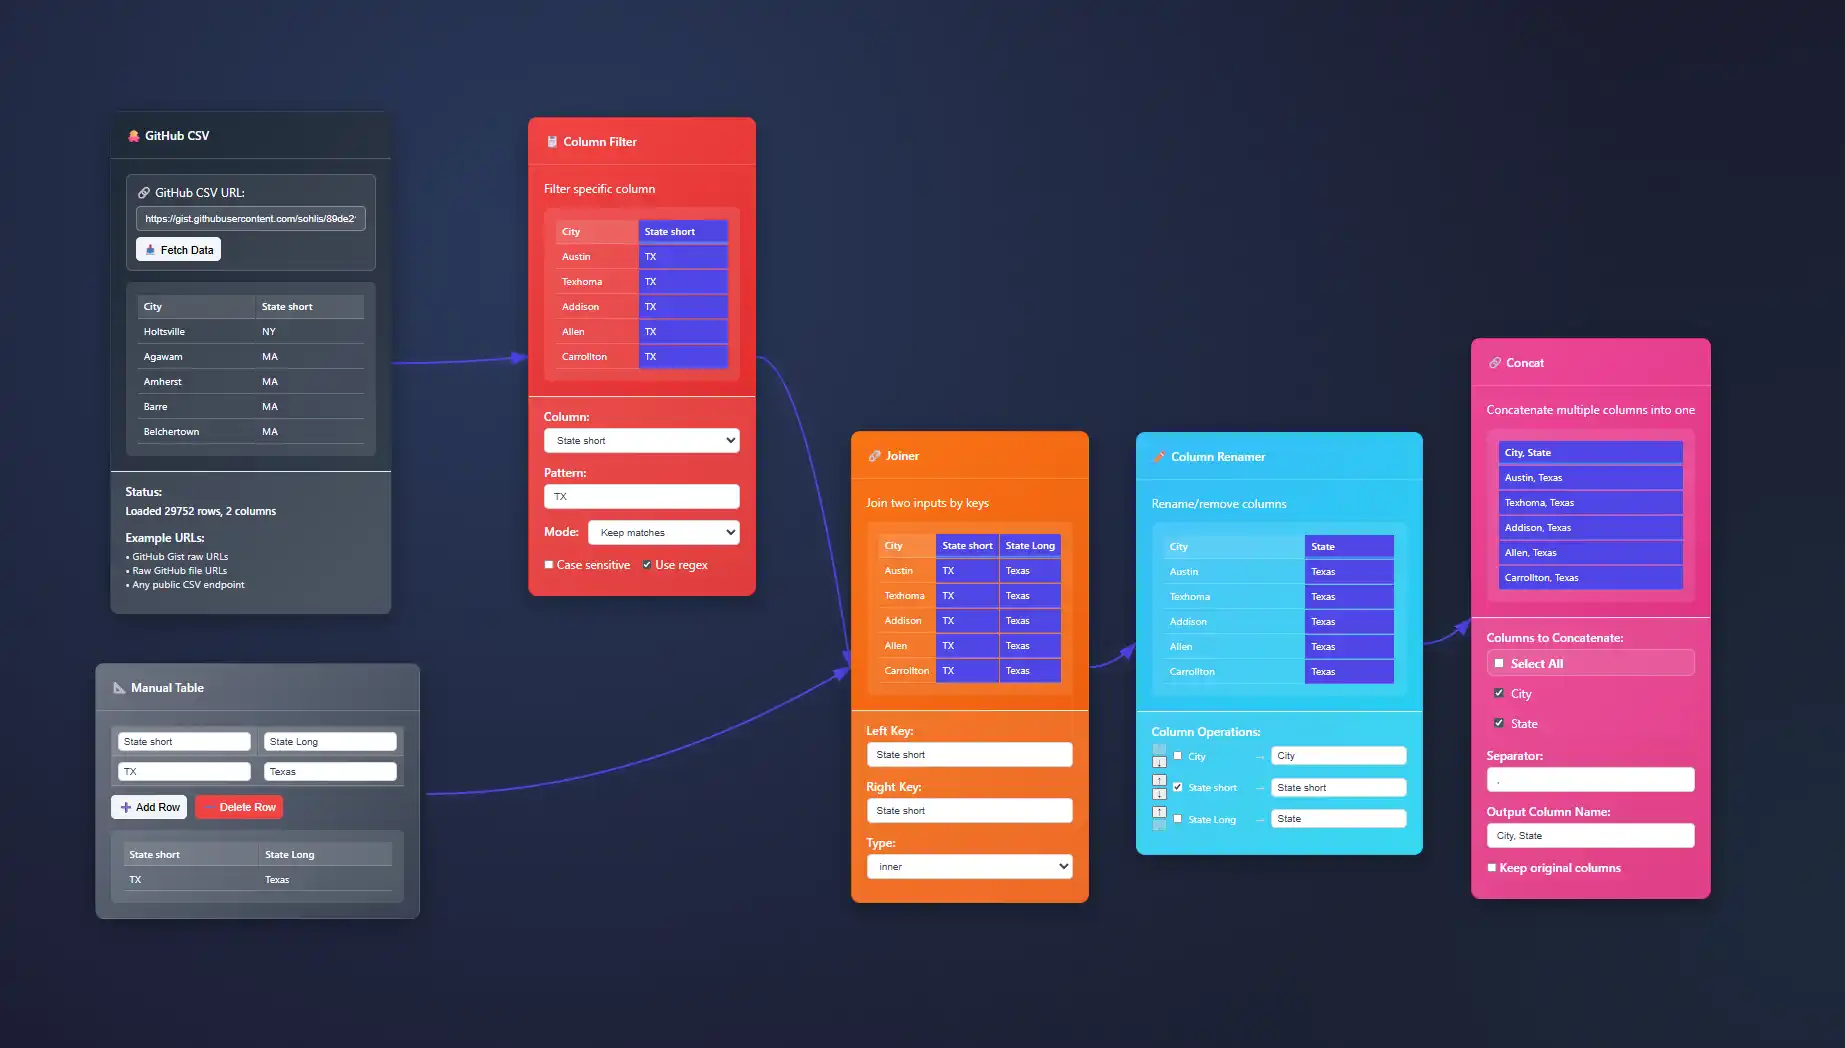
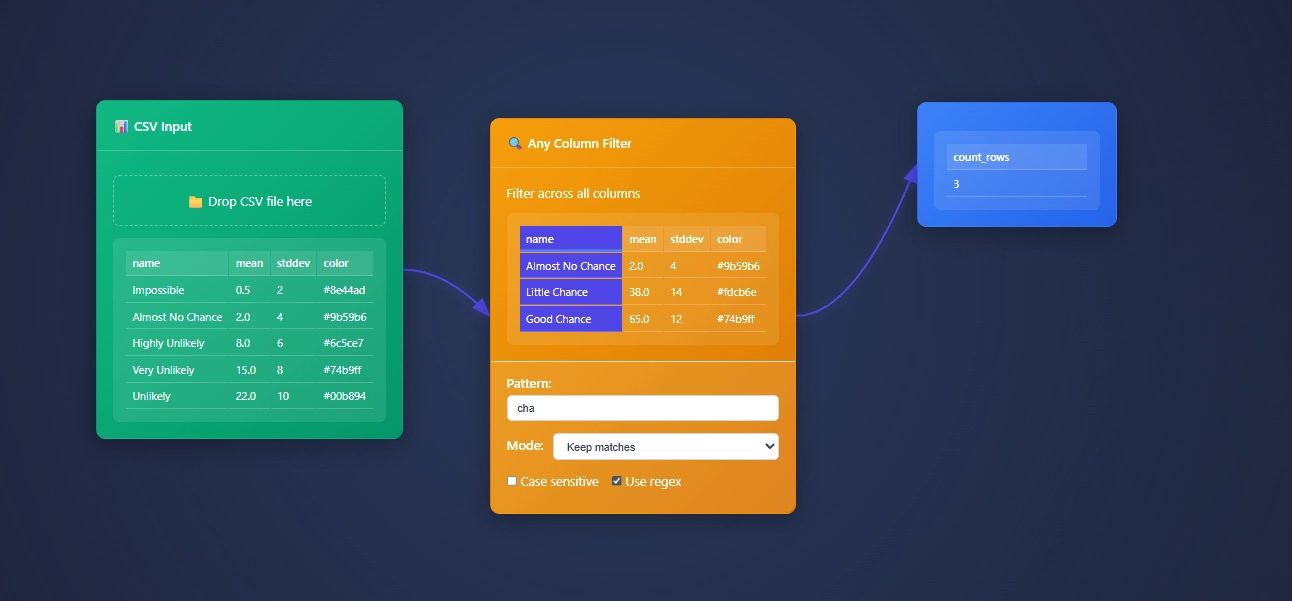
ET1 is a visual data workbench that lets you explore, clean, and explain data in-memory. Built for non-technical humans, (but developer friendly) who want to wrangle data, without complexity.


Create
Hands-on ETL

Training Documentation
Use the training material to help you understand more about ET1 and how it helps solve data wrangling problems.

ET1 Basic Training
If you need help getting started, begin here.

ET1 Video Training
Learn the basics, the features, and more.
Future Insight
We see the future being focused on adoption, training, and creating Easy Tools for anyone. We are building an emerging technology while also maintaining a creative user experience that is inviting and friendly for all ages.
Inspiration
We are inspired by software, video games, and Sci-Fi movies like The Matrix, Minority Report and Ironman. ET1 is created to be “some-what” similar to other legendary software like Alteryx Desktop, and KNIME Analytics Platform.
Join beta.
Why do you want to access beta?
Incremental Processing for Large-Scale Change Data Capture
Handling real-time and large-scale data changes effectively is now fundamental for businesses aiming to remain agile and responsive in today's dynamic market landscape. The explosion of data sources, rapid shifts in consumer behaviors, and growing regulatory...
Pipeline Registry Implementation: Managing Data Flow Metadata
In today's data-driven business landscape, managing and understanding the flow of data across diverse organizational systems has become crucial to unlock innovation and accelerate decision-making. A critical yet often overlooked component in data governance strategies...
Exactly-Once Processing Guarantees in Stream Processing Systems
Imagine your business runs on streaming data, an endless torrent flowing from customers, IoT sensors, or user interactions across your digital platforms. Each event is vital, holding tremendous insight into behavior, opportunities, and performance if processed...
Data Pipeline Circuit Breaker Pattern Implementation
In an era where data pipelines fuel crucial business decisions, even brief disruptions can lead to massive operational and financial consequences. Imagine your organization's revenue forecast suddenly stalls due to unforeseen data pipeline failure, creating blind...
Checkpoint-Based Recovery for Long-Running Data Transformations
Imagine running a critical data transformation task that's been processing for hours or even days, only to experience a sudden crash or unexpected system interruption. The frustration and financial loss stemming from such scenarios aren't just unfortunate—they're...
Waffle Charts for Part-to-Whole Visualization
Imagine making important strategic decisions based on data visualizations that confuse rather than clarify—that's a scenario every data-driven leader wants to avoid. Visualization choices directly impact your audience's ability to interpret and act on data insights....
Visualization Grammar Specification Languages Comparison
Whether it's for technical architects refining enterprise data platforms or senior executives focused on "seeing clearly" through sprawling data estates, selecting the right visualization grammar specification language can make or break the accessibility, usefulness,...
Negative Space Utilization in Dashboard Design
In the rapidly evolving universe of data analytics, dashboards act as the front-end gateway conveying strategic insights to decision-makers. However, achieving clarity isn't merely about filling every inch with graphs or statistics—it's just as crucial about...
Bubble Chart Matrix for Multivariate Correlation Analysis
As business complexity grows, so does the volume of interconnected data available to decision-makers. Yet, this abundance often renders the task of uncovering key multivariate correlations overwhelming without the right visualization strategies. In this context, a...


