Uncomplicate Data
ET1, for humans who hate complex
No ET phone home.
About ET1
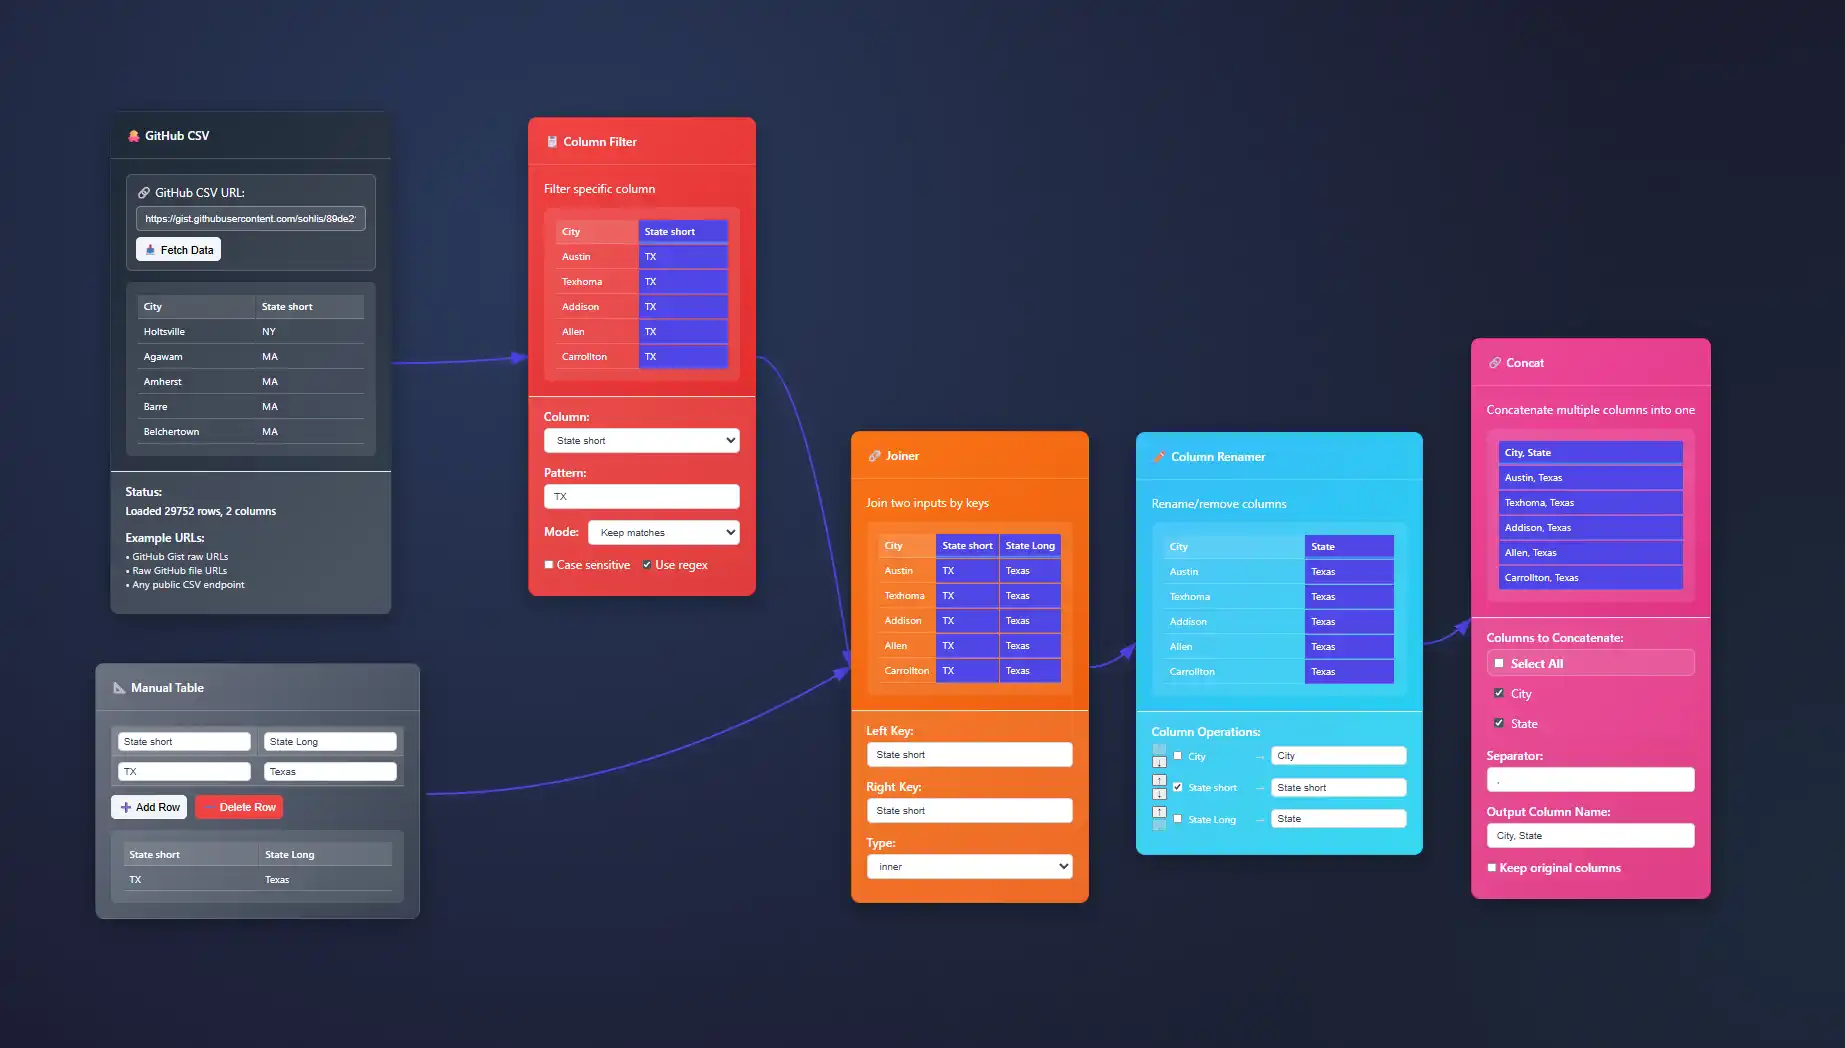
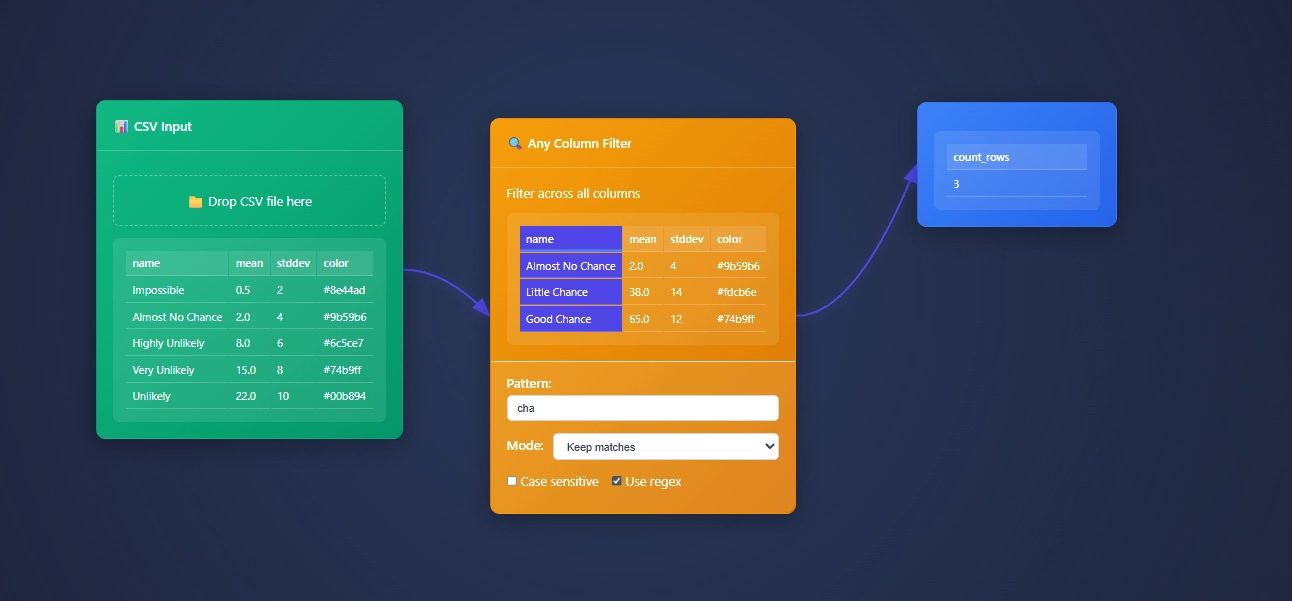
ET1 is a visual data workbench that lets you explore, clean, and explain data in-memory. Built for non-technical humans, (but developer friendly) who want to wrangle data, without complexity.


Create
Hands-on ETL

Training Documentation
Use the training material to help you understand more about ET1 and how it helps solve data wrangling problems.

ET1 Basic Training
If you need help getting started, begin here.

ET1 Video Training
Learn the basics, the features, and more.
Future Insight
We see the future being focused on adoption, training, and creating Easy Tools for anyone. We are building an emerging technology while also maintaining a creative user experience that is inviting and friendly for all ages.
Inspiration
We are inspired by software, video games, and Sci-Fi movies like The Matrix, Minority Report and Ironman. ET1 is created to be “some-what” similar to other legendary software like Alteryx Desktop, and KNIME Analytics Platform.
Join beta.
Why do you want to access beta?
Multi-Scale Visualization for Cross-Resolution Analysis
In our rapidly digitizing world, businesses are gathering data from myriad sources at multiple scales and resolutions. However, effectively interpreting this diverse data landscape can seem daunting—especially without the right tools to visualize across varying levels...
Ridgeline Plots for Distribution Comparison Over Categories
In the fast-evolving landscape of data analytics, decision-makers often face challenges in clearly understanding complex data distributions across different categories. Powerful visualizations like ridgeline plots, also known as density ridge plots or Joyplots, have...
Visualization for Imbalanced Class Distribution in Classification
In today's data-driven world, classification algorithms play a pivotal role in the way companies extract insights and deliver value to stakeholders. Yet, one persistent hurdle these algorithms often face is class imbalance, a situation in which one or more classes...
Isotype Charts: Modern Implementation of Pictogram Visualization
In today's data-driven world, conveying complex information quickly and clearly can mean the difference between informed decisions and missed opportunities. Decision-makers, analysts, and organizational leaders increasingly lean on visual analytics to capture enormous...
Finding the 1% in Your Data That’s Costing You 10% of Revenue
Every division within an organization understands that data-driven decisions are essential for meaningful progress. Yet most managers and analysts overlook small, hidden inefficiencies buried within a company's vast datasets. Imagine this: somewhere in that ocean of...
Implementing Data Version Control in Your Organization
In a fast-paced, data-driven business environment, effectively managing data assets is more critical than ever. Data version control isn't just a convenience—it's the cornerstone of data integrity and consistency across your organization's projects. Just as software...
Delta Lake vs. Iceberg vs. Hudi: Transactional Data Lake Comparison
In the era of data-driven innovation, organizations face critical decisions when architecting data solutions, particularly around how they store and process vast quantities of structured and unstructured data. Traditional data lakes provided flexibility but struggled...
Data Skew Detection and Handling in Distributed Processing
In today's rapidly evolving digital landscape, organizations accumulate vast volumes of data, making distributed processing a necessity rather than a choice. Yet, while distributed data environments scale impressively, they also introduce complexities, notably data...
Human-in-the-Loop Data Pipeline Design Patterns
In today's fast-evolving data landscape, the push toward automation has never been stronger. Companies aim to streamline workflows, gain rapid insights, save on costs, and deliver quality products faster than before. Yet, fully automating complex data-driven workflows...


