Uncomplicate Data
ET1, for humans who hate complex
No ET phone home.
About ET1
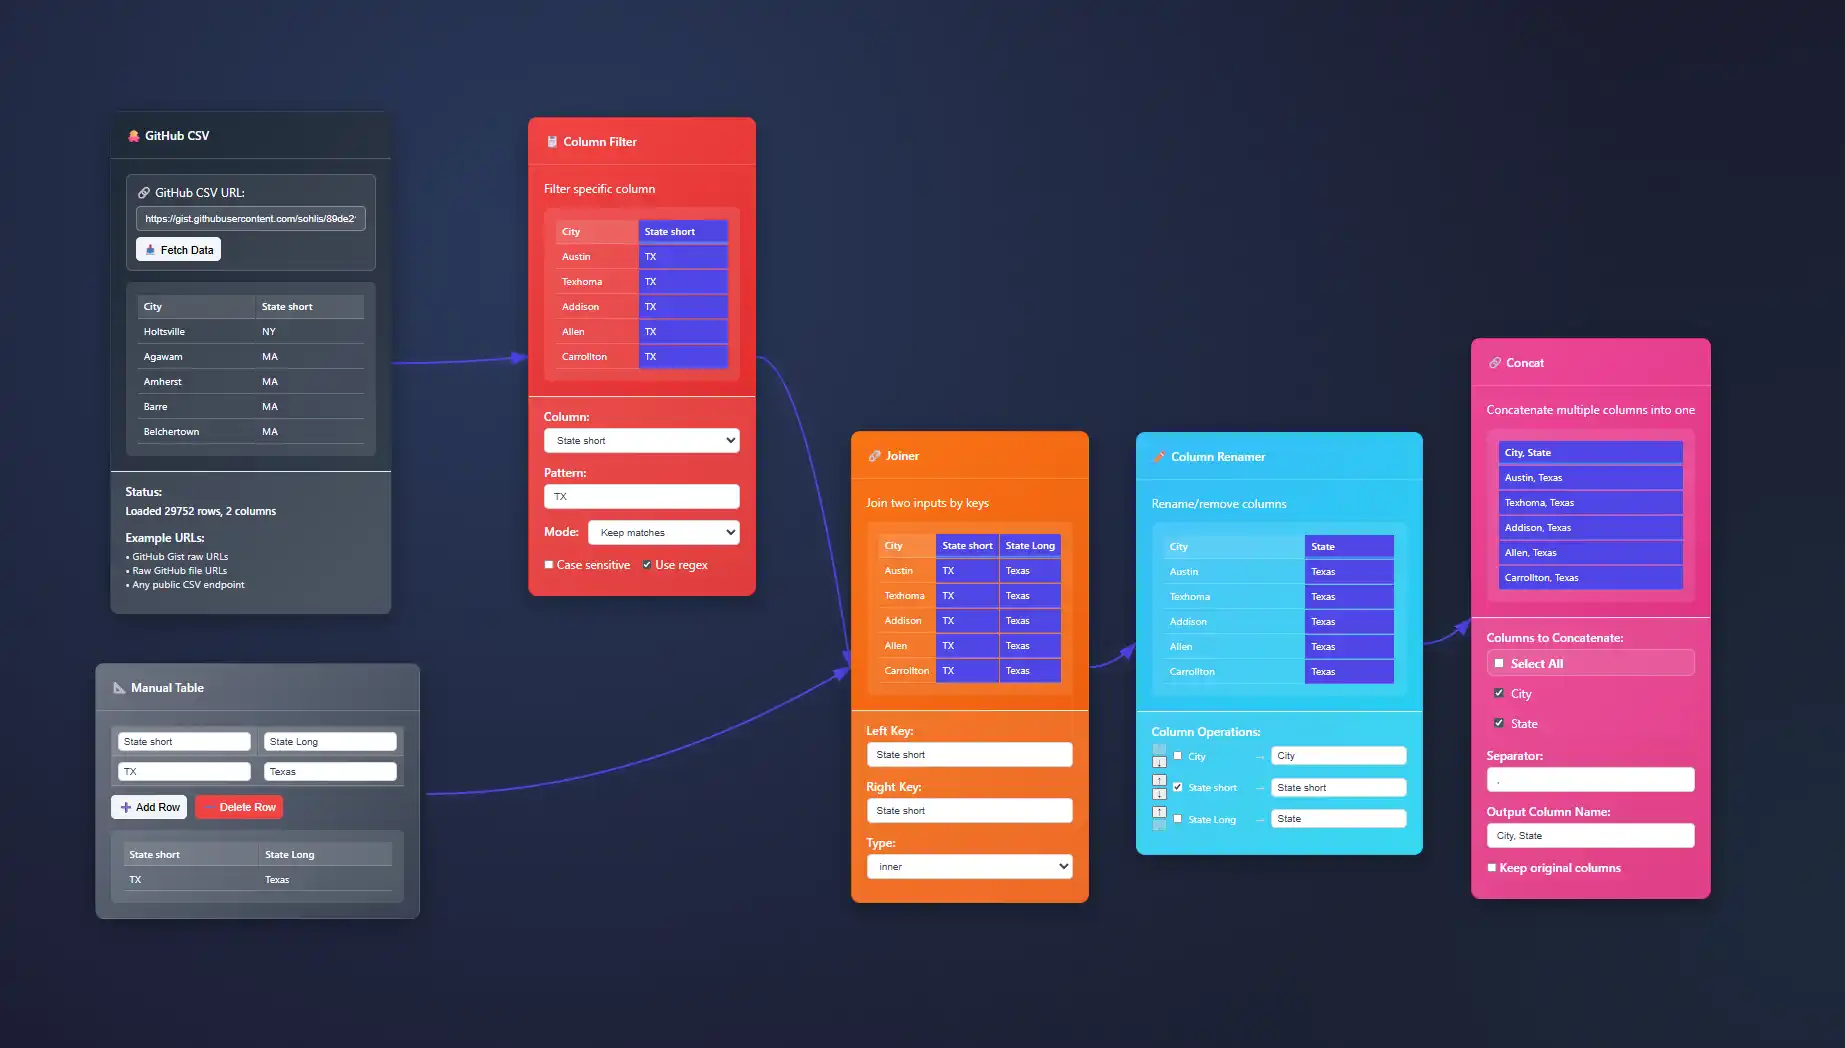
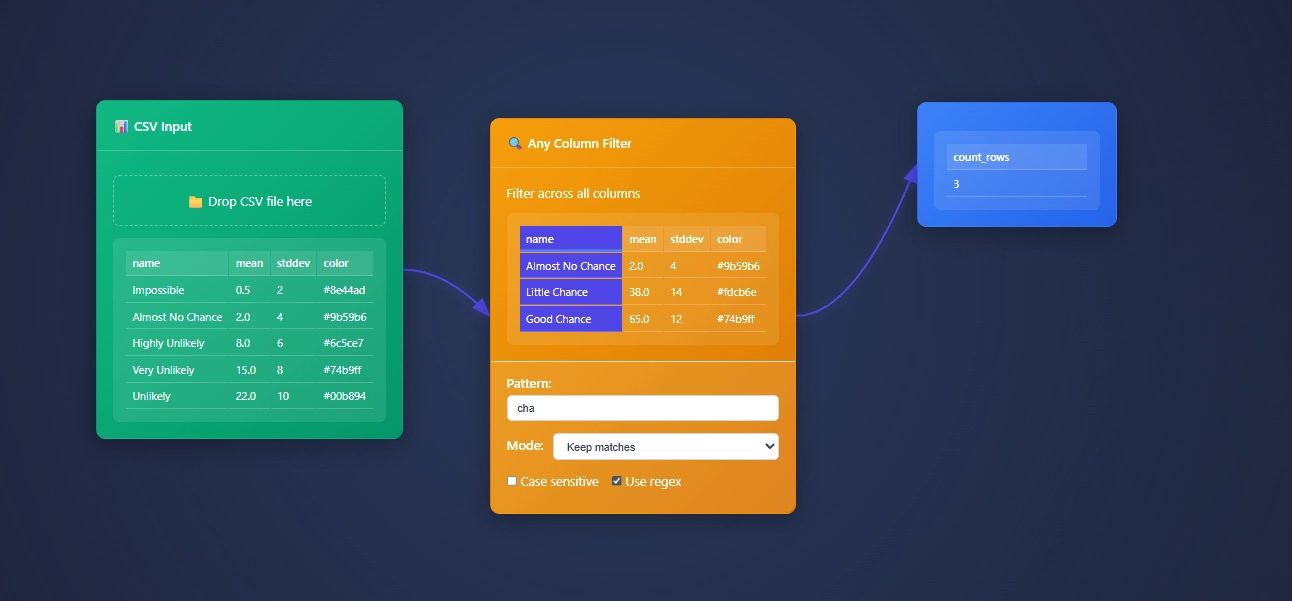
ET1 is a visual data workbench that lets you explore, clean, and explain data in-memory. Built for non-technical humans, (but developer friendly) who want to wrangle data, without complexity.


Create
Hands-on ETL

Training Documentation
Use the training material to help you understand more about ET1 and how it helps solve data wrangling problems.

ET1 Basic Training
If you need help getting started, begin here.

ET1 Video Training
Learn the basics, the features, and more.
Future Insight
We see the future being focused on adoption, training, and creating Easy Tools for anyone. We are building an emerging technology while also maintaining a creative user experience that is inviting and friendly for all ages.
Inspiration
We are inspired by software, video games, and Sci-Fi movies like The Matrix, Minority Report and Ironman. ET1 is created to be “some-what” similar to other legendary software like Alteryx Desktop, and KNIME Analytics Platform.
Join beta.
Why do you want to access beta?
Implementing Fan-Out/Fan-In Patterns for Parallel Data Processing
In today's competitive market where data volume and complexity grow exponentially, organizations must leverage advanced technical strategies to maintain efficiency and innovation. As data ecosystems become increasingly intricate, parallel processing emerges as a...
Data Pipeline Parameterization for Multi-Tenant Processing
In an age where adaptability, scalability, and smart analytics are critical for growth, businesses serving multiple clients—each with unique data landscapes—need data pipelines that flexibly adapt without breaking stride. Enter data pipeline parameterization, a potent...
Canvas Optimization for High-Performance Data Visualization
In today's world of lightning-fast decisions and complex analytics, executives and technical leaders alike are demanding data visualization tools that deliver immediate insights without the added weight of sluggish performance. However, even the best analytical...
Ternary Plots for Three-Variable Compositional Data
In today's rapidly evolving data-driven environment, clarity in data representation is crucial for informed decision-making. As complexity grows, traditional two-dimensional charts often fall short, especially when dealing with compositional datasets. Three-variable...
Typography as a Data Visualization Encoding Channel
Graphic designers and data analysts both strive to communicate complex ideas clearly and effectively. While visualization experts typically focus on graphical elements like color, size, and positioning, the role of typography as a powerful encoding channel is often...
Implementing View Transitions in Multi-State Visualizations
In today's dynamic business environments, complex data visualizations are increasingly critical to informed decision-making. As leaders accustomed to thriving in fast-paced industries, you've likely experienced the challenge of communicating complex messages with...
D3.js Force Simulation for Interactive Network Visualization
Today, businesses are navigating through volumes of complex data, making it challenging to unveil key insights quickly. In a digital era dominated by rapid decision-making and data-driven advancements, executives and data professionals alike demand tools that simplify...
Visualization Heuristic Evaluation Framework
In today's rapidly evolving business world, mastering the art and science of data visualization isn't just an advantage—it's a necessity. Visualization serves as the crucial bridge between complex datasets and precise insights, empowering decision-makers to quickly...
Chart Junk Removal: Maximizing Data-Ink Ratio
Imagine opening a dashboard filled with dazzling visuals, flashy animations, and intricate graphics. Your initial excitement quickly fades as you struggle to decipher the underlying message. When visuals obscure critical insights, this becomes more than an aesthetics...


