Uncomplicate Data
ET1, for humans who hate complex
No ET phone home.
About ET1
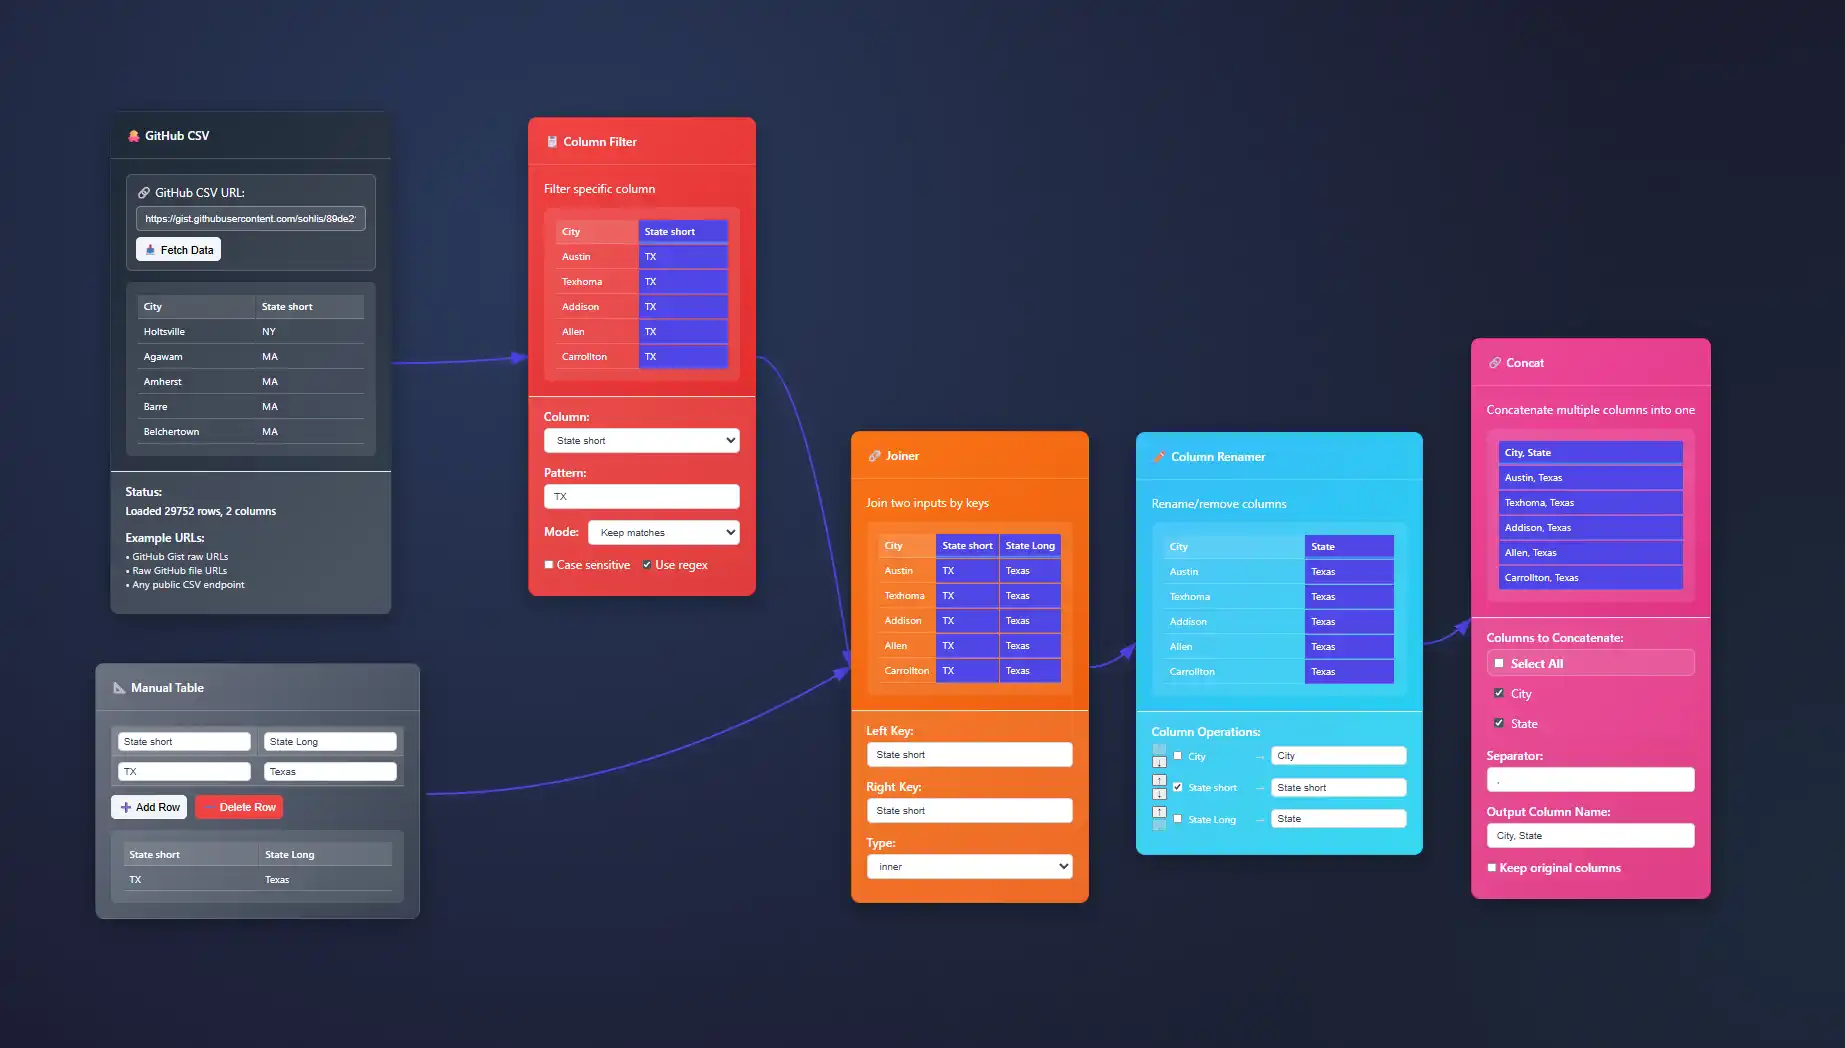
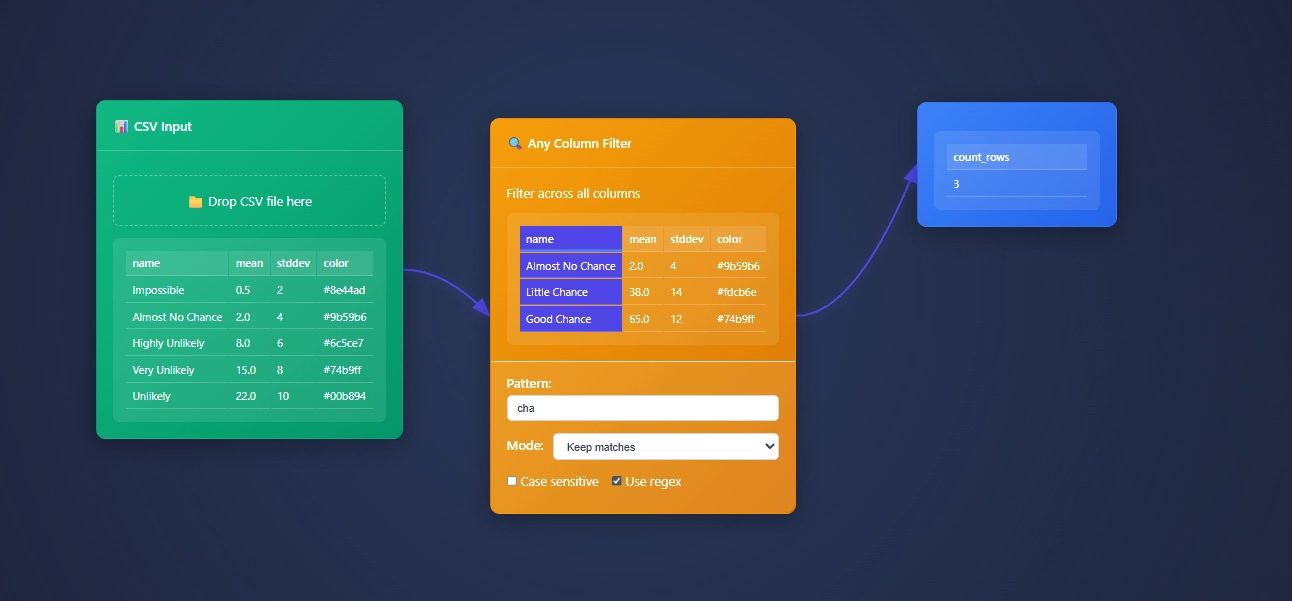
ET1 is a visual data workbench that lets you explore, clean, and explain data in-memory. Built for non-technical humans, (but developer friendly) who want to wrangle data, without complexity.


Create
Hands-on ETL

Training Documentation
Use the training material to help you understand more about ET1 and how it helps solve data wrangling problems.

ET1 Basic Training
If you need help getting started, begin here.

ET1 Video Training
Learn the basics, the features, and more.
Future Insight
We see the future being focused on adoption, training, and creating Easy Tools for anyone. We are building an emerging technology while also maintaining a creative user experience that is inviting and friendly for all ages.
Inspiration
We are inspired by software, video games, and Sci-Fi movies like The Matrix, Minority Report and Ironman. ET1 is created to be “some-what” similar to other legendary software like Alteryx Desktop, and KNIME Analytics Platform.
Join beta.
Why do you want to access beta?
Data Democracy vs. Data Anarchy: Governance Guardrails
Imagine a powerful sports car barreling down an open road: exhilarating freedom, unmatched performance, and unrestricted speed. But now picture the same vehicle navigating twisting mountain roads without guardrails—it becomes an accident waiting to happen. Similarly,...
Multi-Party Computation for Secure Data Analysis
Imagine unlocking critical insights from deeply sensitive data without ever compromising confidentiality. Businesses and public institutions frequently face a paradox: the magnitude of insights analytics could provide and the caution necessary to safeguard sensitive...
Handling Streaming Data at Scale: Technologies and Patterns
In today's data-intensive landscape, waiting for static batch analyses to deliver actionable insights is no longer sufficient. Competitive businesses rely on real-time processing of data streams to monitor customer interactions, operational efficiency, security...
Interactive Legends: Enhancing User Control in Visualizations
In today's data-driven world, visualizations serve as the gateway to actionable insights. However, simply presenting data isn't enough—users demand control that allows dynamic exploration. Visualizations become even more powerful when users can interact effortlessly,...
Fisheye Distortion for Focus+Context Data Exploration
In the modern landscape of data analytics and visual exploration, the ability to quickly isolate critical insights within extensive datasets can be a major determinant of competitive advantage. Imagine if you could swiftly zoom into a critical data insight without...
Designing for Cognitive Load in Complex Data Displays
In today's fast-paced digital landscape, organizations frequently depend on vast, intricate data sets to drive decisions, optimize performance, and innovate. However, even the most advanced data analytics can fail to yield their full potential if the data displays are...
Visualization Consistency Patterns Across Multiple Reports
In today's data-driven landscape, clarity in communication often hinges on visualization consistency. Executives rely on accurate, cohesive visuals to swiftly draw insights and identify strategic opportunities. Yet, many organizations stumble in creating consistency...
Treemap Optimization for Hierarchical Data Representation
In a data-driven, treemap-ping world, the ability to swiftly understand hierarchical information through intuitive visualization techniques has become imperative for informed decision-making. Treemaps are a powerful method, providing crisp, visual clarity to complex...
Visual Encoding Effectiveness: Empirical Research Findings
In today's data-driven world, effectively interpreting and visually communicating complex information is critical for strategic decision-making. Visual encoding—transforming data variables into graphical components like size, position, color, or shape—lies at the...


