Uncomplicate Data
ET1, for humans who hate complex
No ET phone home.
About ET1
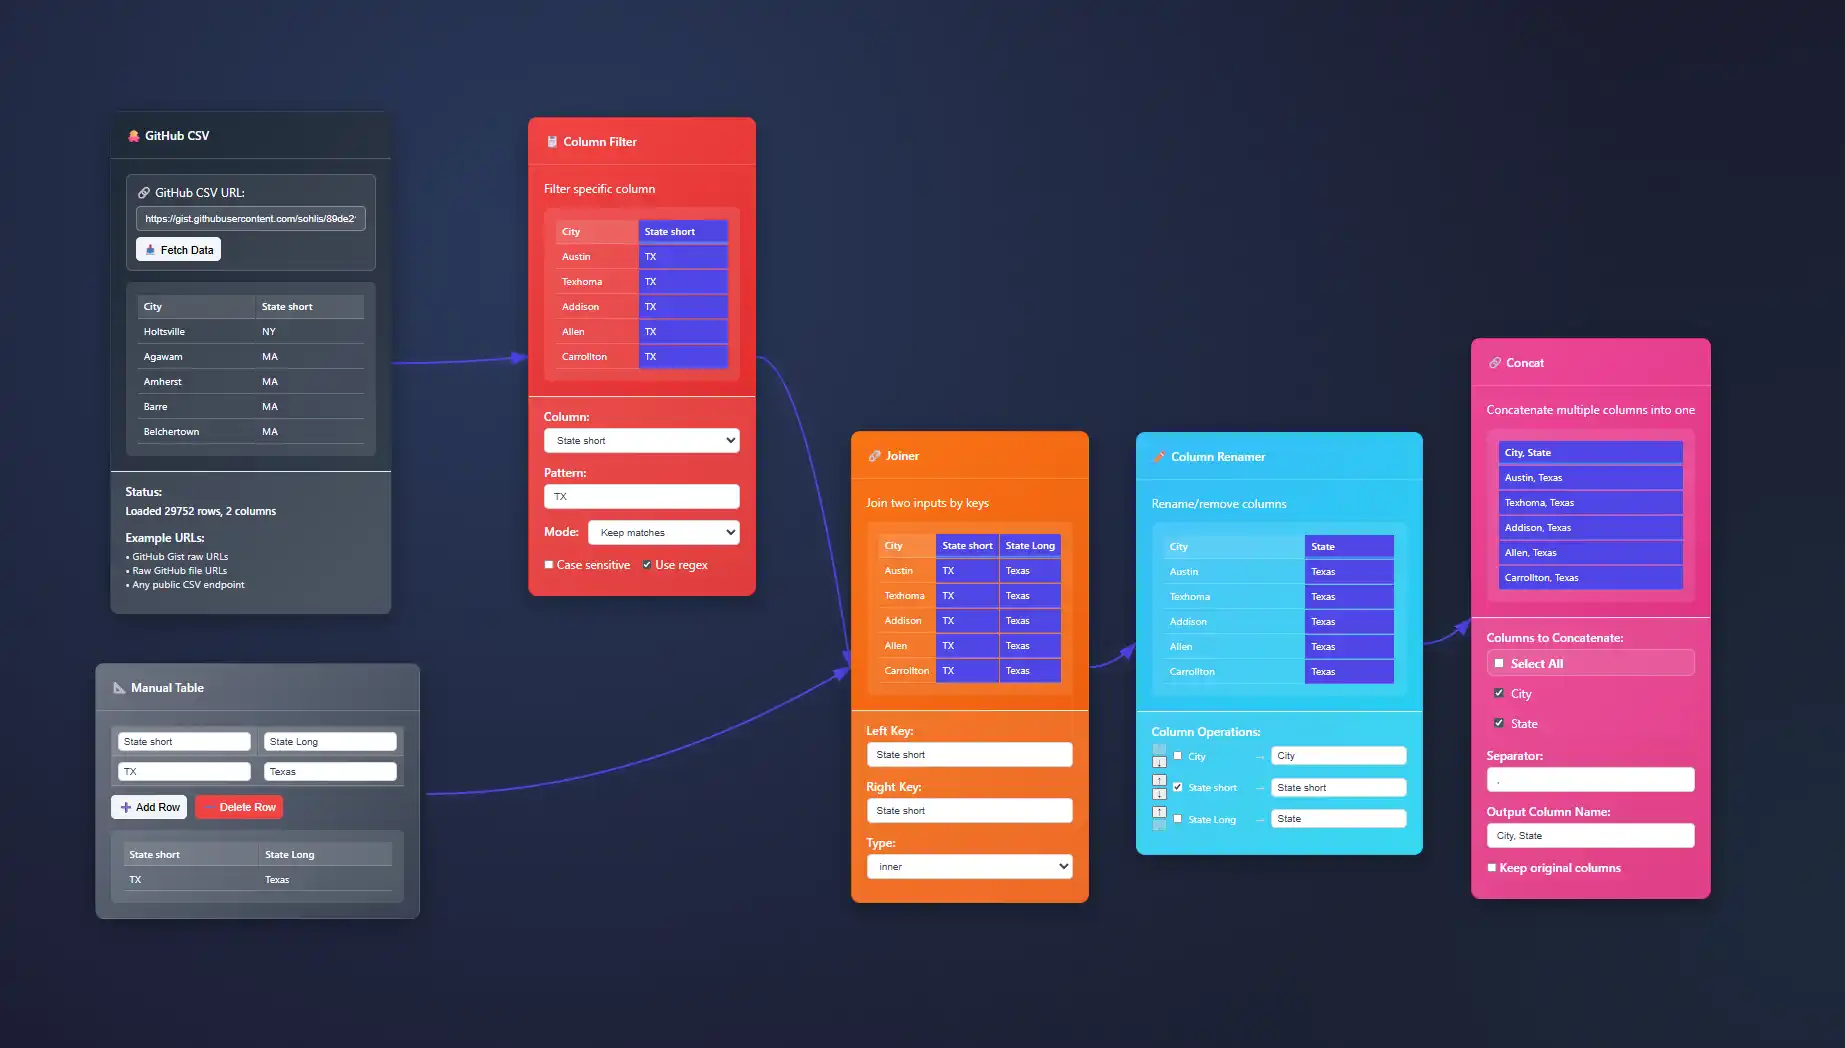
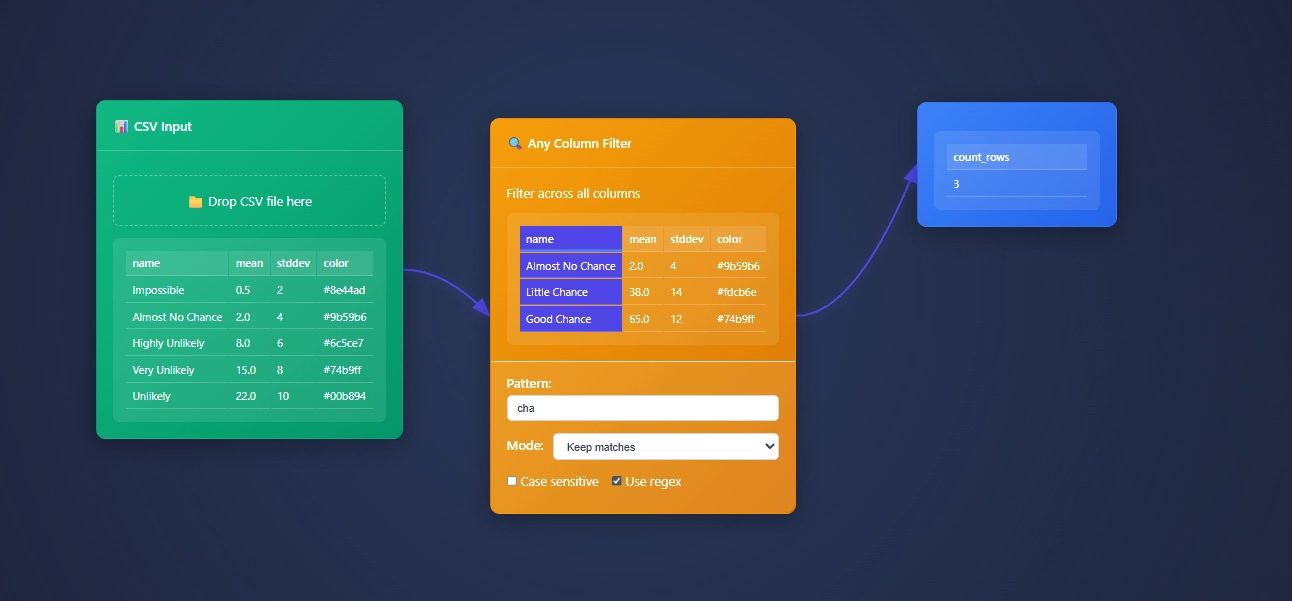
ET1 is a visual data workbench that lets you explore, clean, and explain data in-memory. Built for non-technical humans, (but developer friendly) who want to wrangle data, without complexity.


Create
Hands-on ETL

Training Documentation
Use the training material to help you understand more about ET1 and how it helps solve data wrangling problems.

ET1 Basic Training
If you need help getting started, begin here.

ET1 Video Training
Learn the basics, the features, and more.
Future Insight
We see the future being focused on adoption, training, and creating Easy Tools for anyone. We are building an emerging technology while also maintaining a creative user experience that is inviting and friendly for all ages.
Inspiration
We are inspired by software, video games, and Sci-Fi movies like The Matrix, Minority Report and Ironman. ET1 is created to be “some-what” similar to other legendary software like Alteryx Desktop, and KNIME Analytics Platform.
Join beta.
Why do you want to access beta?
Implementing Data Product Management Framework
The rules of business competition have transformed. Today's valuable commodities are data-driven insights and efficiency, not only physical products or services. Leading businesses now recognize the need to treat data itself as a strategic product, managed by robust...
Rights Management for Derived Data Assets
In an era where data fuels innovation, companies stand or fall by how effectively they manage their data assets. While most enterprises acknowledge the importance of securing primary datasets, fewer pay enough attention to derived data—the enriched, transformed, and...
Micro-Interaction Design in Interactive Data Exploration
Have you ever wondered why some data dashboards feel intuitive, fast, and seamless, while others make exploration tedious? The answer often lies in the subtle yet powerful micro-interactions within the interface. Micro-interactions are tiny design moments that guide...
Preattentive Visual Processing in Dashboard Design
Imagine glancing at a complex dashboard and instantly grasping critical insights without needing to consciously sift through every detail. In a world saturated with data, preattentive visual processing empowers decision-makers to intuitively understand information at...
Network Visualization Layout Algorithms Comparison
Imagine stepping into your company's data landscape and instantly understanding the complex connections driving decision-making and innovation. Effective network visualization algorithms make this possible—transforming intricate webs of data into clear, actionable...
Horizon Charts for Dense Time Series Visualization
Decision-makers drowning in voluminous datasets understand the critical importance of clear and informative visualizations. Conceived with dense analytics in mind, horizon charts rise as a powerful solution designed specifically for displaying complex time series data...
Data Trust Implementation for Protected Information Sharing
In today's highly interconnected digital landscape, organizations across industries increasingly rely on sharing sensitive data to achieve mutual objectives. Whether supporting collaborative research in healthcare, ensuring seamless operations in complex supply...
Conformity Dimension Management in Data Warehousing
In today's information-driven landscape, organizations rely heavily on their data warehouses as central repositories of truth, yet often struggle with consistency across relevant dimensions. Ensuring conformity dimension management is not merely a technical choice,...
Business Capability to Data Asset Mapping Registry
The modern enterprise landscape is increasingly driven by information, analytics, and strategic insights derived from data. Imagine your organization as an intricate orchestra, each instrument representing a unique business capability, and the data assets acting as...


