Uncomplicate Data
ET1, for humans who hate complex
No ET phone home.
About ET1
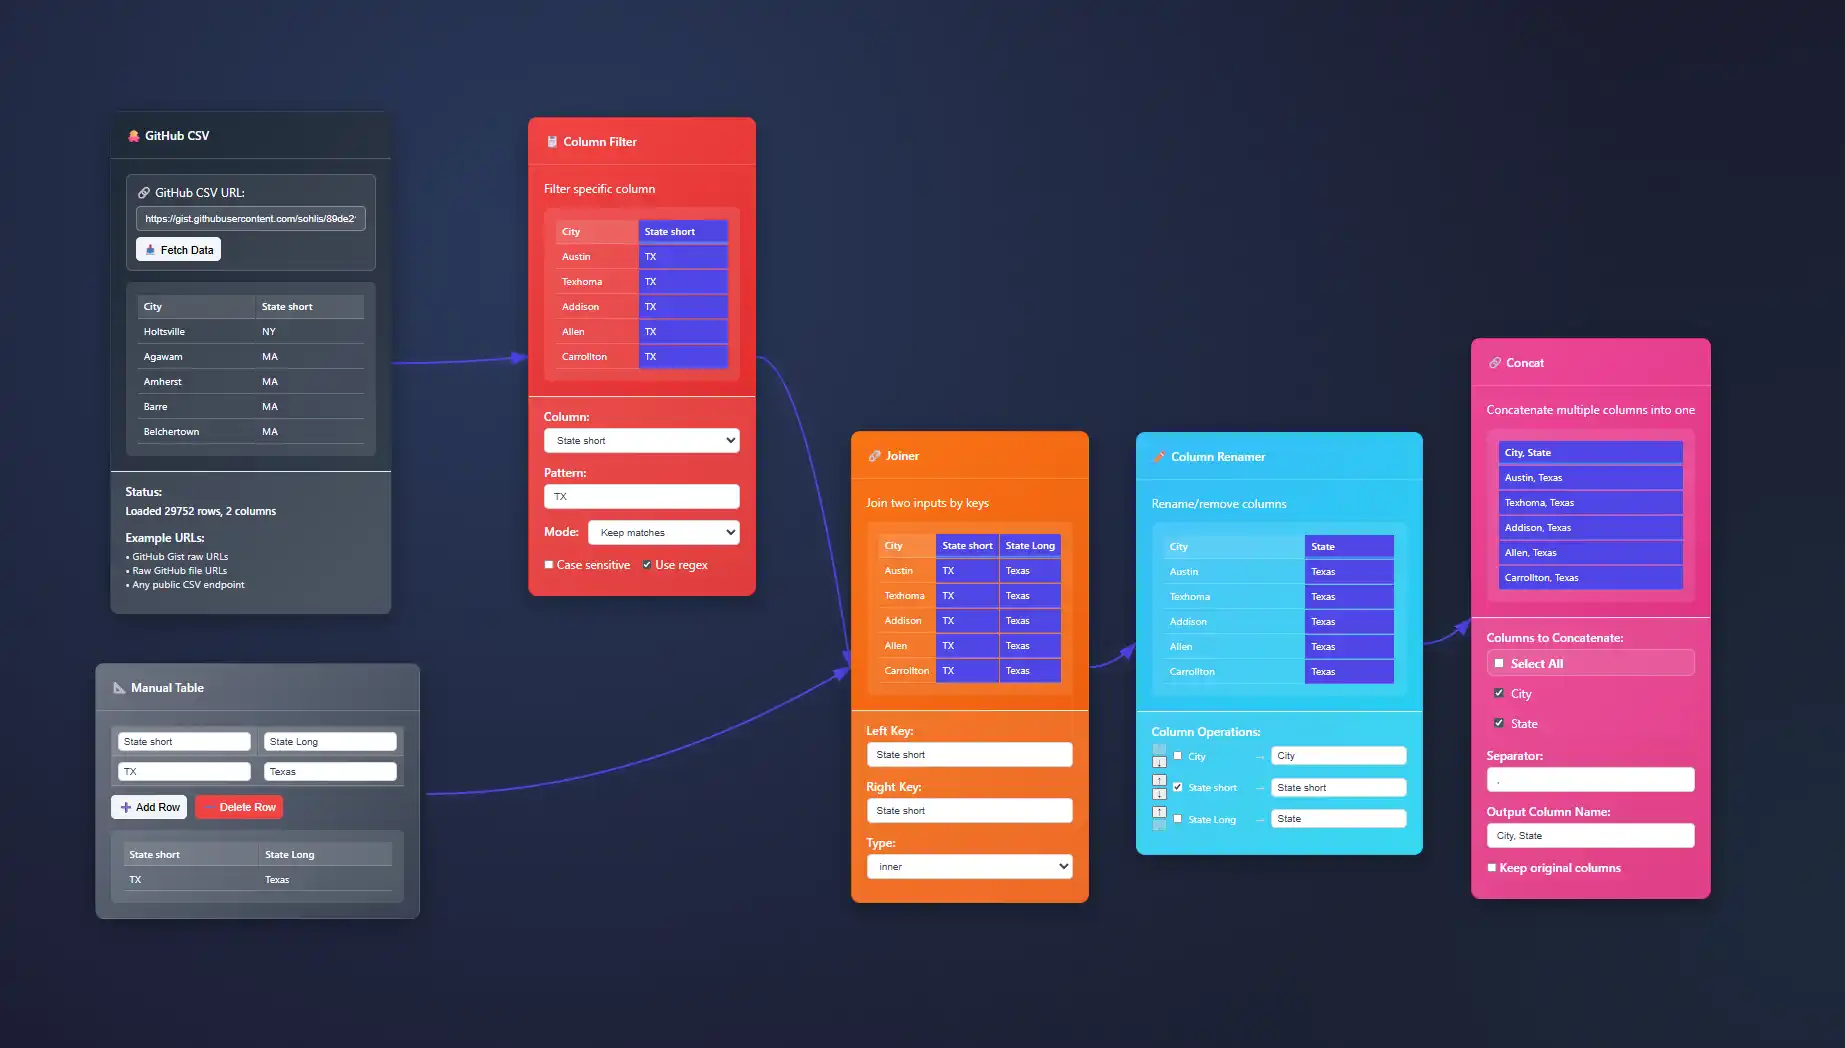
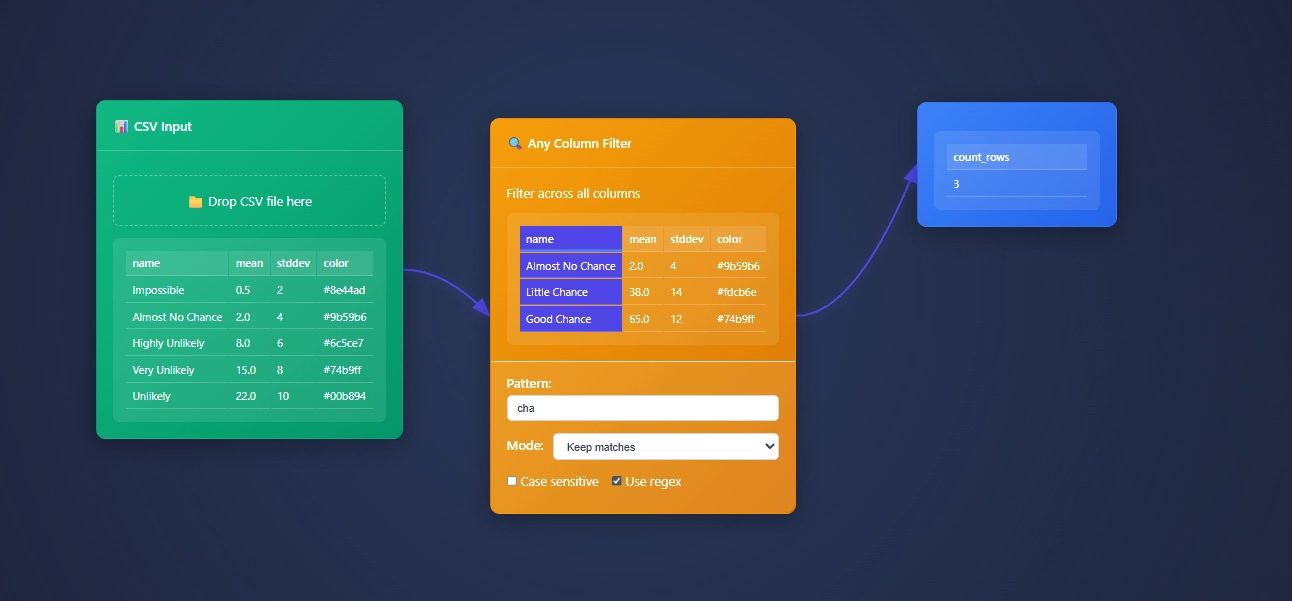
ET1 is a visual data workbench that lets you explore, clean, and explain data in-memory. Built for non-technical humans, (but developer friendly) who want to wrangle data, without complexity.


Create
Hands-on ETL

Training Documentation
Use the training material to help you understand more about ET1 and how it helps solve data wrangling problems.

ET1 Basic Training
If you need help getting started, begin here.

ET1 Video Training
Learn the basics, the features, and more.
Future Insight
We see the future being focused on adoption, training, and creating Easy Tools for anyone. We are building an emerging technology while also maintaining a creative user experience that is inviting and friendly for all ages.
Inspiration
We are inspired by software, video games, and Sci-Fi movies like The Matrix, Minority Report and Ironman. ET1 is created to be “some-what” similar to other legendary software like Alteryx Desktop, and KNIME Analytics Platform.
Join beta.
Why do you want to access beta?
How to Transition from Traditional ETL to Modern Data Engineering
Businesses today live and breathe data, needing access not just to raw information but sophisticated insights that strategically empower decisions. Historically, companies relied on traditional Extract, Transform, Load (ETL) processes to develop data analytics...
Uncertainty Visualization Techniques for Statistical Data
In today's rapidly evolving data-driven world, statistics and analytics lead the way, guiding insight, innovation, and strategic decision-making. Yet, behind every data point lies inherent uncertainty—variables that can cloud judgment, complicate interpretation, and...
Perceptual Edge Detection in Chart Design
In today's fast-paced data-driven world, interpreting visual information quickly and accurately can be the difference between strategic success and missed opportunities. As decision-makers, we rely heavily on visual insights to shape strategies, understand customer...
Interactive Brushing and Linking in Multi-View Dashboards
In today’s data-driven world, dashboards aren’t just static summaries—they're dynamic, interactive canvases, empowering decision-makers to explore insights visually and intuitively. Specifically, combining interactive brushing and linking in multi-view dashboards...
Typography Best Practices for Data-Dense Displays
In today's data-intensive environment, decision-makers increasingly rely on complex visual tools and dashboards to harness analytics, extract insights, and drive strategic choices. Yet, even the most sophisticated data can become obscured and misunderstood if the...
Radial Visualization Techniques for Cyclical Data Patterns
In the digital age, businesses increasingly grapple with datasets characterized by cyclical patterns—data fluctuating over regular intervals, such as hourly website traffic, seasonal sales performance, or monthly system loads. As decision-makers, interpreting these...
Workflow-Integrated Data Quality Validation Gates
Organizations that want to thrive in a competitive landscape fuel their strategies with data. Yet, ambitious visions built on data-driven insights turn precarious when the very foundation—the data itself—is questionable. Today’s businesses require more robust,...
Metadata-Driven Data Obfuscation for Non-Production
Imagine your team diligently building innovative solutions, utilizing powerful analytics and cutting-edge data insights to drive critical business decisions. But alongside innovation, one foundational element must never be compromised: data security. Especially when...
Schema Registry Enforcement in Data Integration Flows
Modern enterprises constantly wrestle with massive data flows pouring in from multiple touchpoints, applications, and business units. Managing these disparate streams can become overwhelmingly complex without robust validation, governance, and adherence to standard...


