Uncomplicate Data
ET1, for humans who hate complex
No ET phone home.
About ET1
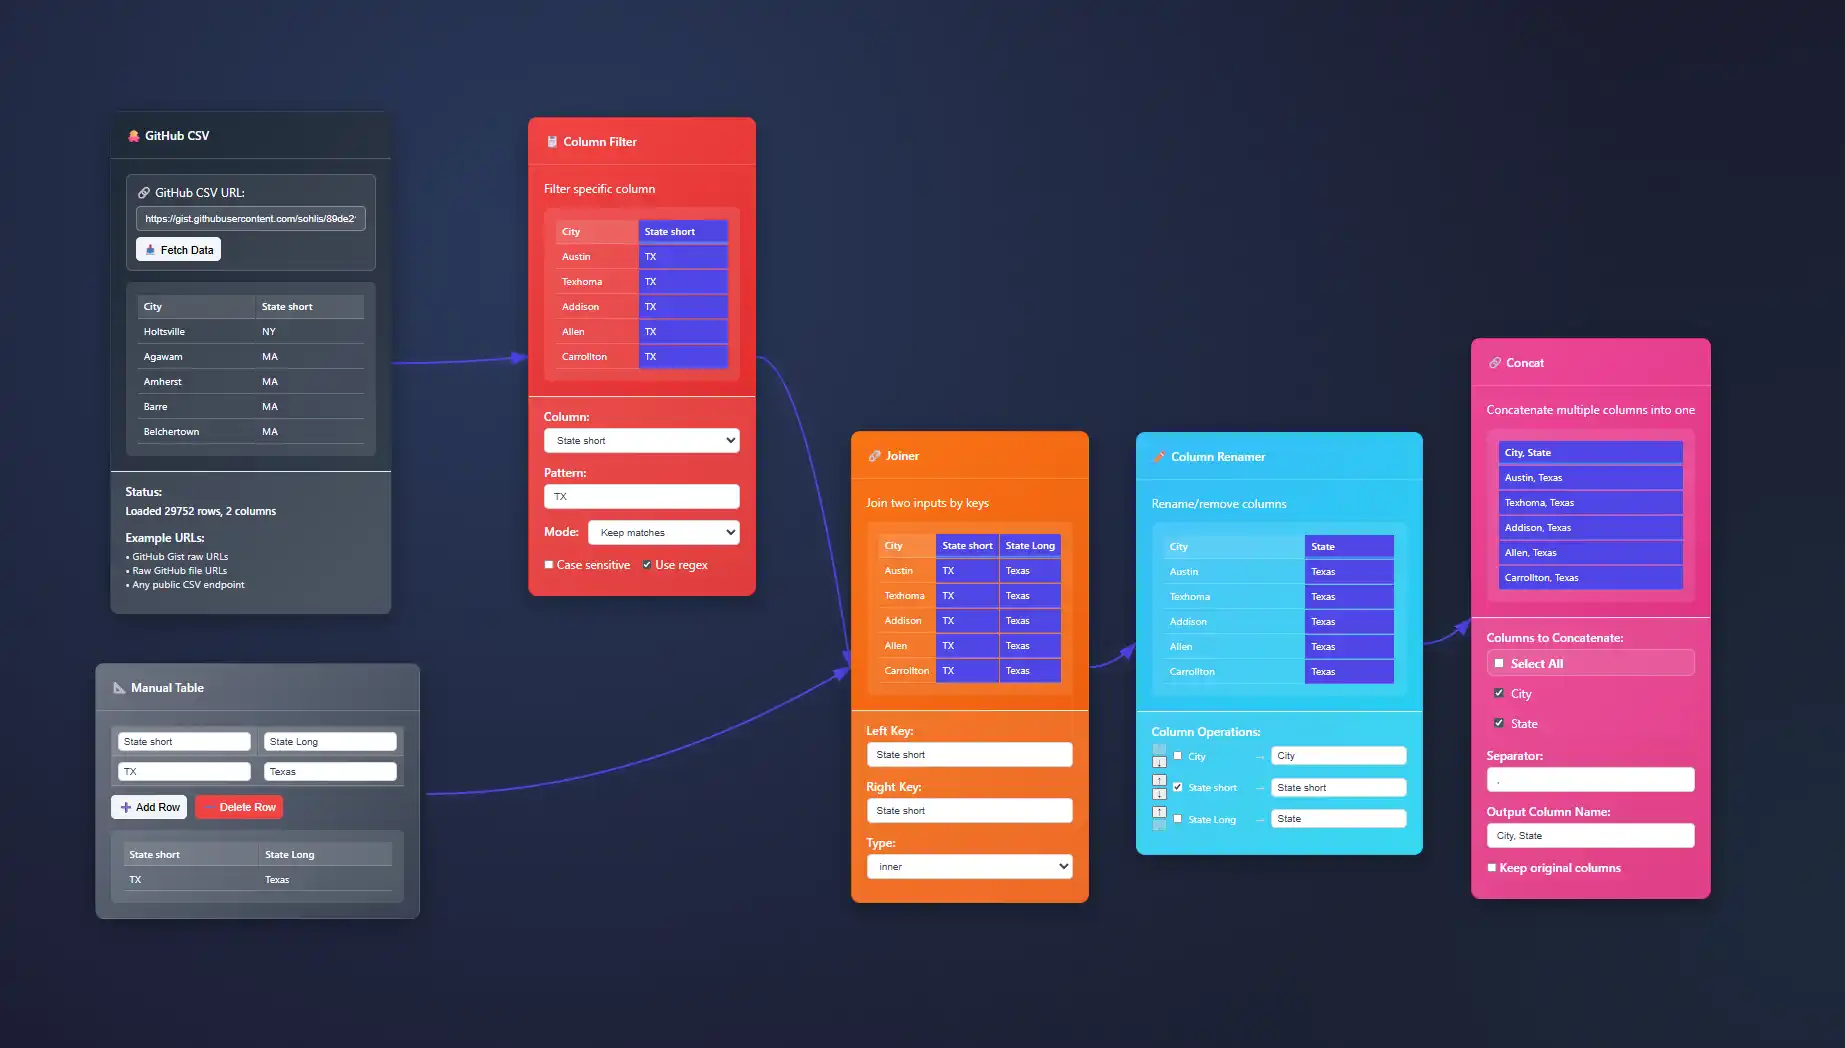
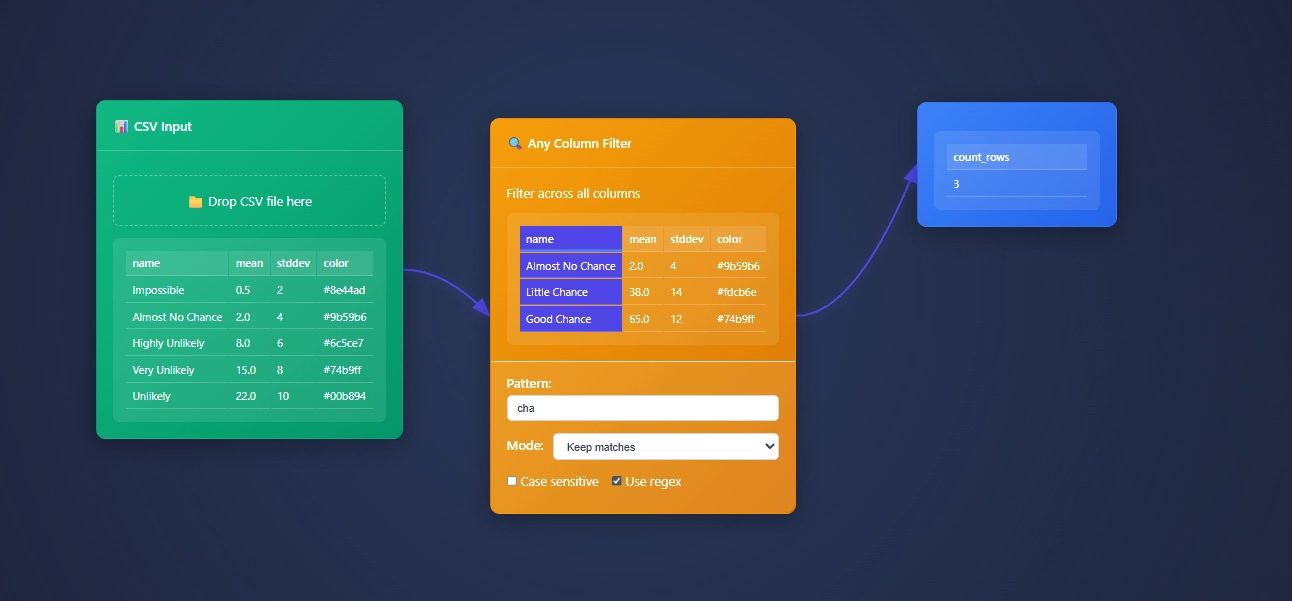
ET1 is a visual data workbench that lets you explore, clean, and explain data in-memory. Built for non-technical humans, (but developer friendly) who want to wrangle data, without complexity.


Create
Hands-on ETL

Training Documentation
Use the training material to help you understand more about ET1 and how it helps solve data wrangling problems.

ET1 Basic Training
If you need help getting started, begin here.

ET1 Video Training
Learn the basics, the features, and more.
Future Insight
We see the future being focused on adoption, training, and creating Easy Tools for anyone. We are building an emerging technology while also maintaining a creative user experience that is inviting and friendly for all ages.
Inspiration
We are inspired by software, video games, and Sci-Fi movies like The Matrix, Minority Report and Ironman. ET1 is created to be “some-what” similar to other legendary software like Alteryx Desktop, and KNIME Analytics Platform.
Join beta.
Why do you want to access beta?
Animated Sparklines for Real-Time Data Monitoring
In today's rapidly evolving digital landscape, leaders and decision-makers need actionable insights at a glance. Enter animated sparklines—concise yet powerful visualizations that provide real-time context, clarity and simplicity to complex data streams. As technology...
Unit Visualization: Showing Individual Data Points at Scale
Every business leader knows that within every data set lie powerful insights waiting to be uncovered. Yet, when working at scale, crucial details often become obscured as we summarize or aggregate data to provide quick views. Enter unit visualization—a powerful...
Gestalt Principles Applied to Analytics Dashboard Design
Successful analytics dashboards must do more than simply aggregate data—they must guide users to insights clearly and intuitively. As decision-makers increasingly rely on data for strategic moves, it is crucial to ensure dashboards communicate information efficiently...
Parallel Coordinates Plots for Multivariate Data Analysis
In today’s rapidly evolving data-driven landscape, organizations must make sense of intricate, multidimensional data to maintain a critical edge in a competitive market. With datasets growing in both size and complexity, traditional visualization techniques often fall...
Narrative Visualization Techniques for Data Storytelling
In today's digitally accelerated environment, data has evolved beyond numbers and charts—it's become a canvas for compelling stories that drive strategic decisions. Effective storytelling through narrative visualization can transform complex analytical insights into...
3D Visualization Techniques: When They Add Value vs. Distract
The world of data visualization continues to evolve rapidly, bringing forward technologies that allow more insightful and intuitive representations of complex data. Today, one of the more sophisticated methods emerging in the field is 3D visualization. But while these...
Federated Data Governance Implementation Across Business Units
In today's fast-paced digital landscape, businesses seek agility, flexibility, and faster insights into their operations. Effective data governance isn't merely regulatory adherence—it's an indispensable enabler of innovation, data accuracy, and strategic growth....
Data Sovereignty Requirements: Regional Compliance Implementation
Understanding data sovereignty is no longer a luxury—it's an absolute business necessity for thriving companies across the globe. As regulations around data management evolve rapidly, aligning your organization's approach to compliance is critical for risk mitigation,...
Legal Entity Identifier Integration for Cross-System Identification
In today's interconnected economy, clear and precise entity identification across digital systems isn't just helpful—it's essential. When organizations navigate complex global markets, redundant or fragmented entity identification can lead to costly errors, compliance...


