Uncomplicate Data
Create end-to-end data analytics solutions in one app that is simple to use, and self-explanatory.
About ET1
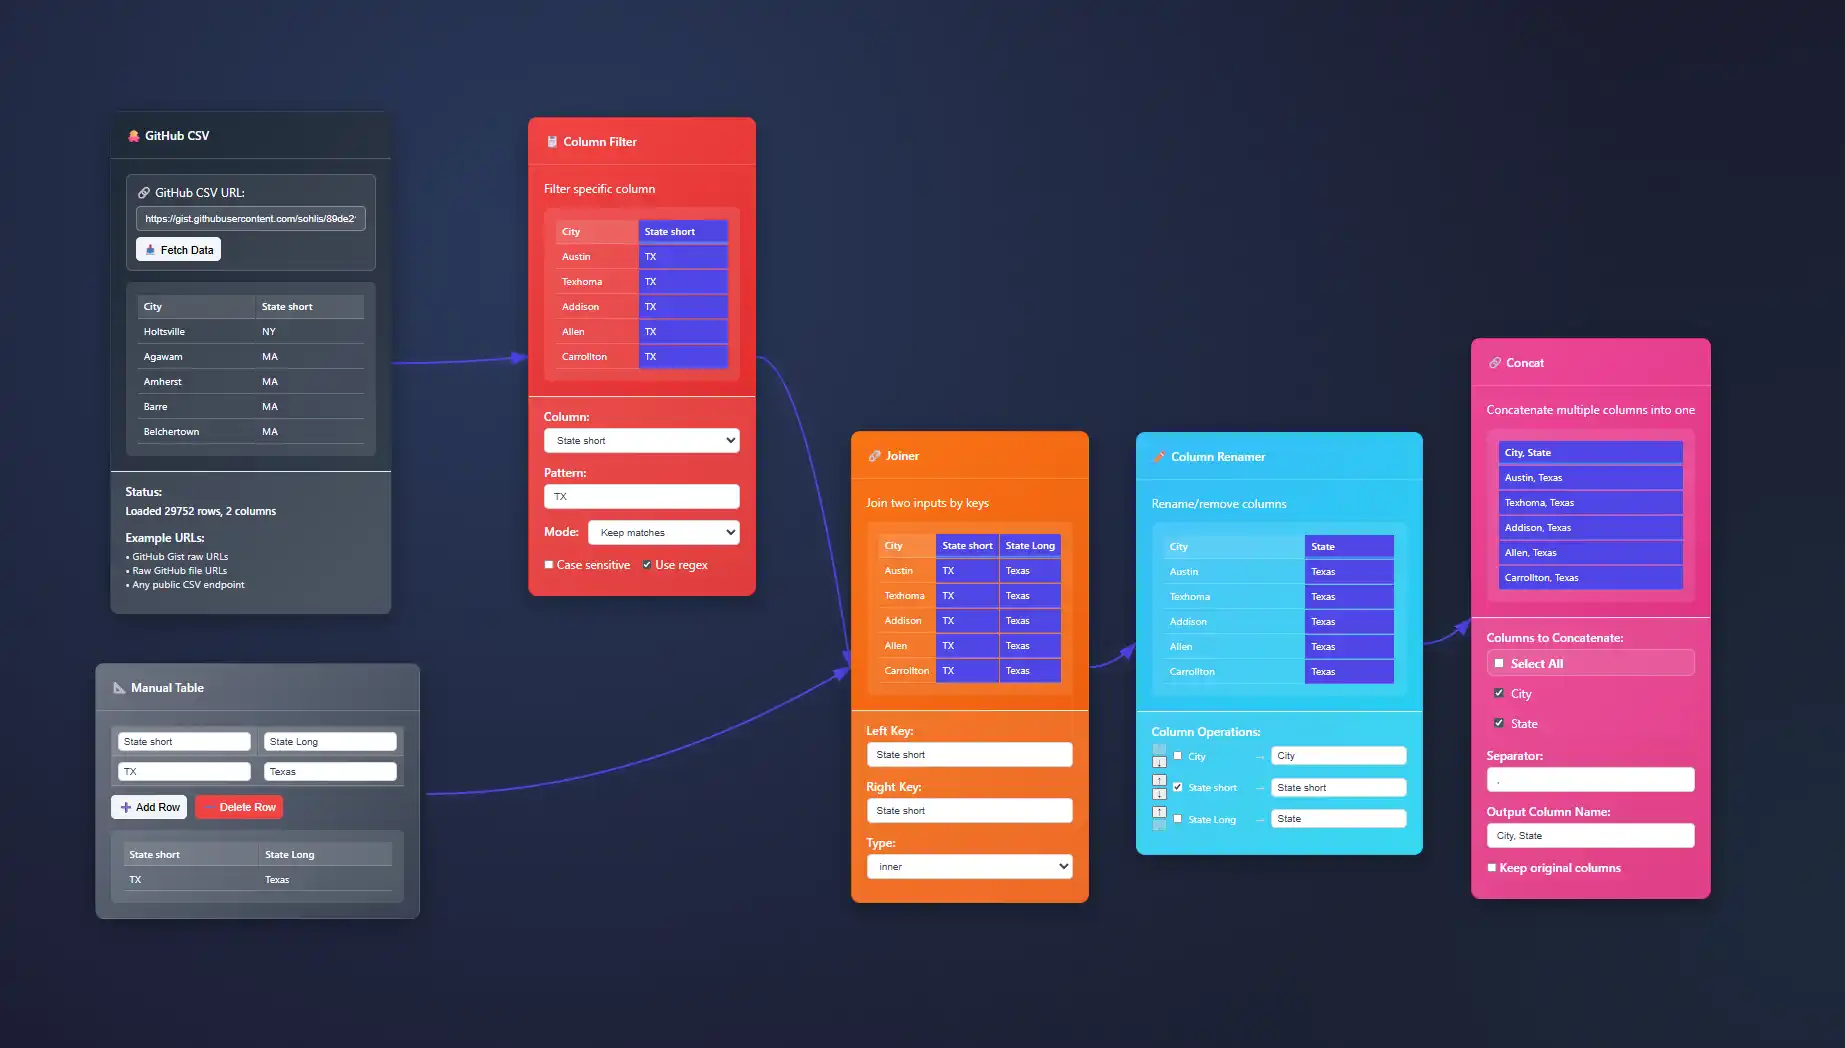
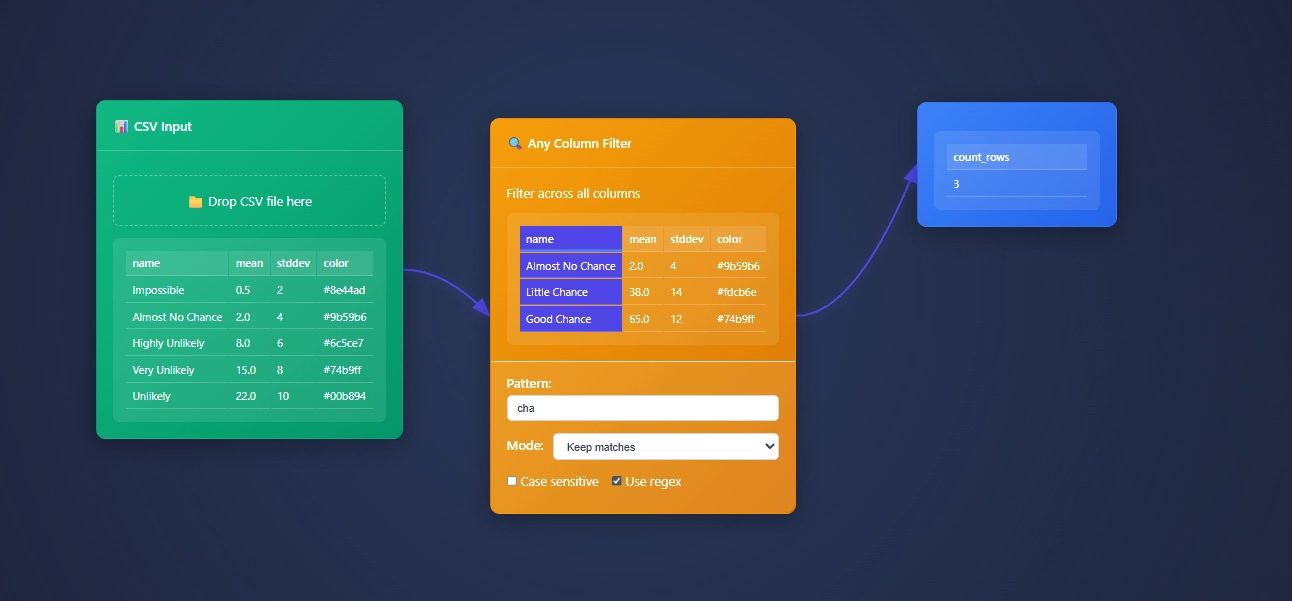
ET1 is a visual data workbench that lets you explore, clean, and explain data solutions.


- Access ET1
- Unlock 24 nodes
- Free ETL software
- Desktop friendly
- Code on GitHub iCore utilities, UI pieces, and node definitions live in the public repository so you can review how processing works.
- No storage
- ET1.1 + GitHub OAuth
- Unlock 29 nodes
- Workflows + Neon LakeiNeon Lake is the persistent store for workflow data and results. The free tier has no storage. This tier includes limited storage and 1 branch.
- 100/CU-monthiCU = Compute Unit. An internal measure we use to track processing cost across transforms.
- 500 MB storageiStorage in Neon Lake for tables and results. Retention policies may apply while we tune usage.
- 1 BranchiThis tier includes a single branch only.
- ET1.1 + GitHub OAuth
- Unlock 29 nodes
- Workflows + Neon Lake
- $0.28/CU-houriMetered compute beyond included quota. Priced per compute-hour equivalent derived from CU usage.
- $0.46/GB-monthiNeon Lake storage billed by logical GB-month. We may introduce archival tiers.
- 3 BranchesiEach branch has isolated CPU and storage. You only pay for the delta (the difference) between branches.
- SOC 2 • HIPAA • GDPR
- Regional locations
- User-level pricing
- $0.52/CU-hour
- $0.49/GB-month
- 10 Branches
- Unlimited databases & tables
Training Documentation
Use the training material to help you understand more about ET1 and how it helps solve data wrangling problems.

ET1 Basic Training
If you need help getting started, begin here.

ET1 Video Training
Learn the basics, the features, and more.
Future Insight
We see the future being focused on adoption, training, and creating Easy Tools for anyone. We are building an emerging technology while also maintaining a creative user experience that is inviting and friendly for all ages.
Inspiration
We are inspired by software, video games, and Sci-Fi movies like The Matrix, Minority Report and Ironman.
Join beta.
Why do you want to access beta?
Unicode Nightmares Solved: Processing Multi-Language Text
In the digital era, data doesn't speak a single language—it's a multilingual symphony playing across global applications, databases, and interfaces. This multilingual reality brings with it complexities, intricacies, and sometimes outright nightmares in the form of...
Lineage Tracking at Scale Without Sacrificing Throughput
As digital environments grow increasingly complex, tracking data lineage becomes vital for organizations aiming for transparency, trust, and operational efficiency. Implementing scalable lineage tracking without compromising throughput is a unique challenge businesses...
Hot Partitions: The Hidden Curse in Distributed Pipelines
In the fast-paced world of data pipelines and analytics, companies turn to distributed systems to achieve scalability, efficiency, and performance. However, hidden beneath these layers of scalability lurks an insidious challenge known as "hot partitions." These...
Quantum Internet Visualization: Entanglement Network Mapping
As quantum computing edges closer to reshaping entire industries, one particularly intriguing aspect of this emerging technology is the quantum internet. Unlike traditional data networks, quantum networks make use of quantum entanglement—a phenomenon Einstein famously...
Data Fabric Visualization: Stitching Hybrid Workloads
Imagine your hybrid data workloads as a symphony orchestra—each instrument valuable on its own, but truly transformative only when harmonized by the conductor. In the music of modern analytics, your data strategy serves as the conductor, managing diverse data sources,...
Brain-Computer Interface Analytics: Neural Signal Visualization
Imagine a world where our brains directly communicate with technology, bridging cognition and computation seamlessly. Brain-computer interfaces (BCIs) are evolving from futuristic concepts to transformative realities, unlocking profound potential in healthcare,...
Dark Data Discovery: Illuminating Unused Information Visually
In today's rapidly evolving data-driven world, organizations sit atop mountains of information, yet vast quantities of data remain hidden in obscurity—unused, unseen, and untapped. Termed "dark data," these overlooked data assets hold tremendous potential to deliver...
Metaverse Analytics: Virtual World Data Visualization Platforms
Welcome to the new age of analytics, a place where immersive experiences meet precise insights—the Metaverse. As virtual worlds continue to expand, businesses have begun leveraging these digital ecosystems for more than just gaming or social connections—they're...
Real-Time Dashboard Performance: WebGL vs Canvas Rendering Benchmarks
In today's hyper-competitive market, visually compelling and responsive real-time dashboards are no longer simply attractive enhancements—they're mission-critical tools empowering strategic business decisions. Whether monitoring operational metrics in manufacturing,...
Features of Today()+1
Available Now()


