Uncomplicate Data
Extract, transform, load, visualize. ET1 helps you create end-to-end analytics solutions. Start Bronze ET1.
About ET1
ET1 is a visual data workbench that lets you explore, clean, and explain data solutions. Pay for usage, not licenses.

- Access ET1
- Unlock 24 nodes
- Free ETL software
- Desktop friendly
- Code on GitHub iCore utilities, UI pieces, and node definitions live in the public repository so you can review how processing works.
- No storage
- ET1.1 + GitHub OAuth
- Unlock 31 nodes
- Workflows + Neon LakeiNeon Lake is the persistent store for workflow data and results. The free tier has no storage. This tier includes limited storage and 1 branch.
- 100/CU-monthiCU = Compute Unit. An internal measure we use to track processing cost across transforms.
- 500 MB storageiStorage in Neon Lake for tables and results. Retention policies may apply while we tune usage.
- 1 BranchiThis tier includes a single branch only.
- ET1.1 + GitHub OAuth
- Unlock 31 nodes
- Workflows + Neon Lake
- $0.28/CU-houriMetered compute beyond included quota. Priced per compute-hour equivalent derived from CU usage.
- $0.46/GB-monthiNeon Lake storage billed by logical GB-month. We may introduce archival tiers.
- 3 BranchesiEach branch has isolated CPU and storage. You only pay for the delta (the difference) between branches.
- SOC 2 • HIPAA • GDPR
- Regional locations
- User-level pricing
- $0.52/CU-hour
- $0.49/GB-month
- 10 Branches
- Unlimited databases & tables
Training Documentation
Use the training material to help you understand more about ET1 and how it helps solve data wrangling problems.

ET1 Basic Training
If you need help getting started, begin here.

ET1 Video Training
Learn the basics, the features, and more.
Data Inputs
CSV, JSON, and Github CSVs. Extract the data.
Filters
Filter by measure, use regex, wild cards, across your data.
Merge
Inner join, left join, stack with union, and concat columns.
Aggregate
Minimum, maximum, mean, sum, and yes, group by.
Streaming
Flow data downstream. Never click run.
Consulting
Expert help.
Keep it Simple.
Future Insight
We see the future being focused on adoption, training, and creating Easy Tools for anyone. We are building an emerging technology while also maintaining a creative user experience that is inviting and friendly for all ages.
Inspiration
We are inspired by software, video games, and Sci-Fi movies like The Matrix, Minority Report and Ironman.
Join beta.
Why do you want to access beta?
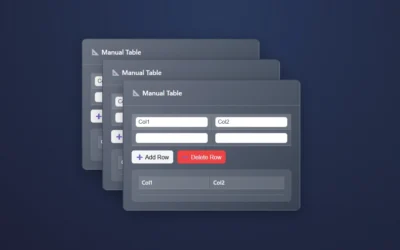
ET1 Manual Table Node
Create a table manually using the Manual Table Node. Manual Table node falls under the data input node category. Built to help you create small tables that you need to use in your data pipelines. When you need a thin layer of data, this is a great tool for manually...
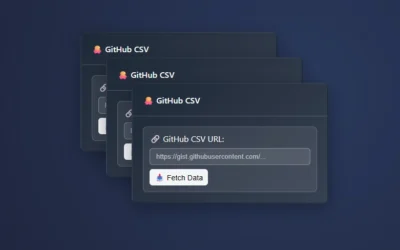
ET1 Github CSV Node
ET1's Github CSV Node is designed to help end users extract data from Github CSV URLs which are in public repositories. A public repository on Github is not a place to put your private or company information. However City/State for USA is a commonly used resource in...

ET1 CSV Input Node
The CSV Input Node, what a classic, flat files living on your computer can be consumed and the data can be extracted here in ET1. CSV is a common file type for data gurus. Comma-Separated Values, a plain text file format for storing tabular data with values separated...

ET1 JSON Input Node
When extracting data from a JSON file, try the JSON Input Node. JSON (JavaScript Object Notation) is a common data source. With ET1's JSON Input Node you can quickly open your JSON files and begin to transform the data, merge it with other data like offline CSV Node...
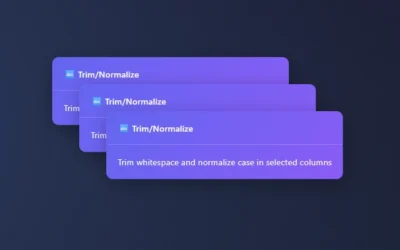
ET1 Trim/Normalize Node
Trim/Normalize Node is built to help you quickly clean your data pipelines and like the Column Renamer, built to make data pipeline maintaining simple, not complicated, and more than anything, easy to repeat. AT TIMES WE NEED CAPITAL LETTERS! Perhaps...
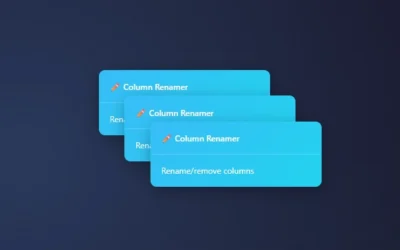
ET1 Column Renamer Node
Renaming columns in ET1 is straightforward and intuitive. You can also move the position of your columns by bumping the column left or right. Last, but not least, the ability to remove the column from the table. Column Renamer in ET1 is the place to manage your...
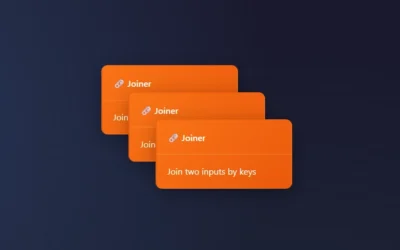
ET1 Joiner Node
On your magic quest to join data? We call it the Joiner node. A simple joining solution that helps people join data at a row level. In ET1, Joiner is focused on "keeping it simple" and will aim to automatically infers your joins. ET1 assumes. Inferring a join means it...
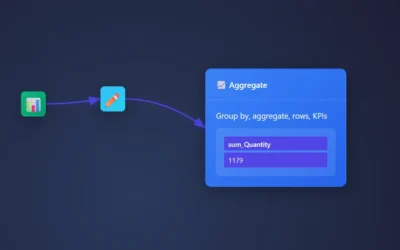
Create a KPI with ET1
Need a KPI? Aggregating the entire column into 1 value? ET1 has this capability built into the aggregation node. By using the Aggregation Node in ET1, and skipping the Group By column in ET1, you can immediately jump into creating column level KPI values. To create a...
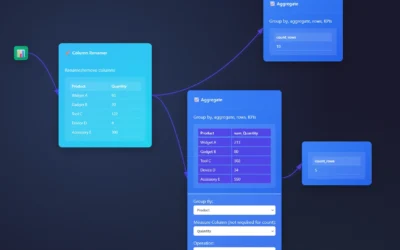
ET1 Group By Overview
Eager to group data? The Group By feature can be found in the Aggregation Node. Add the aggregation node to the canvas and send data downstream to this node. We have many products, however duplicate quantities across many suppliers, and we need to check the quantity...
Features of Today()+1
Available Now()