Uncomplicate Data
Create end-to-end data analytics solutions in one app that is simple to use, and self-explanatory.
About ET1
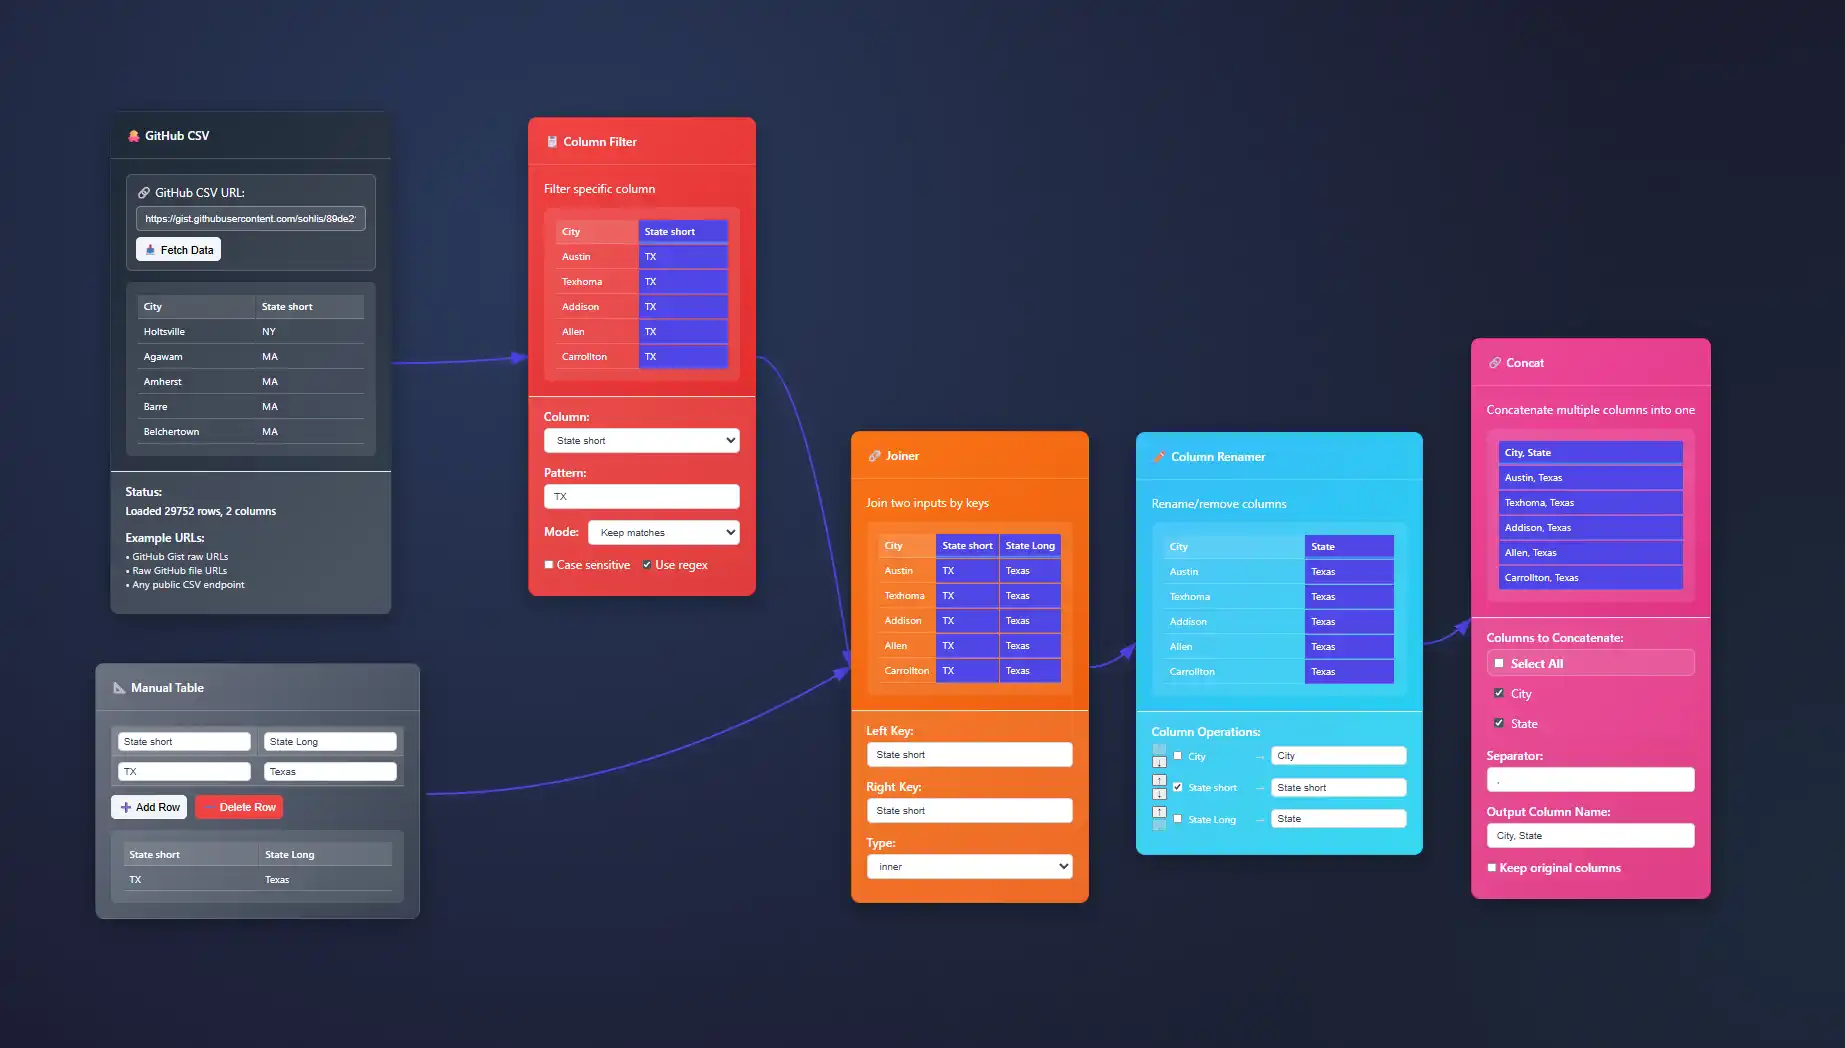
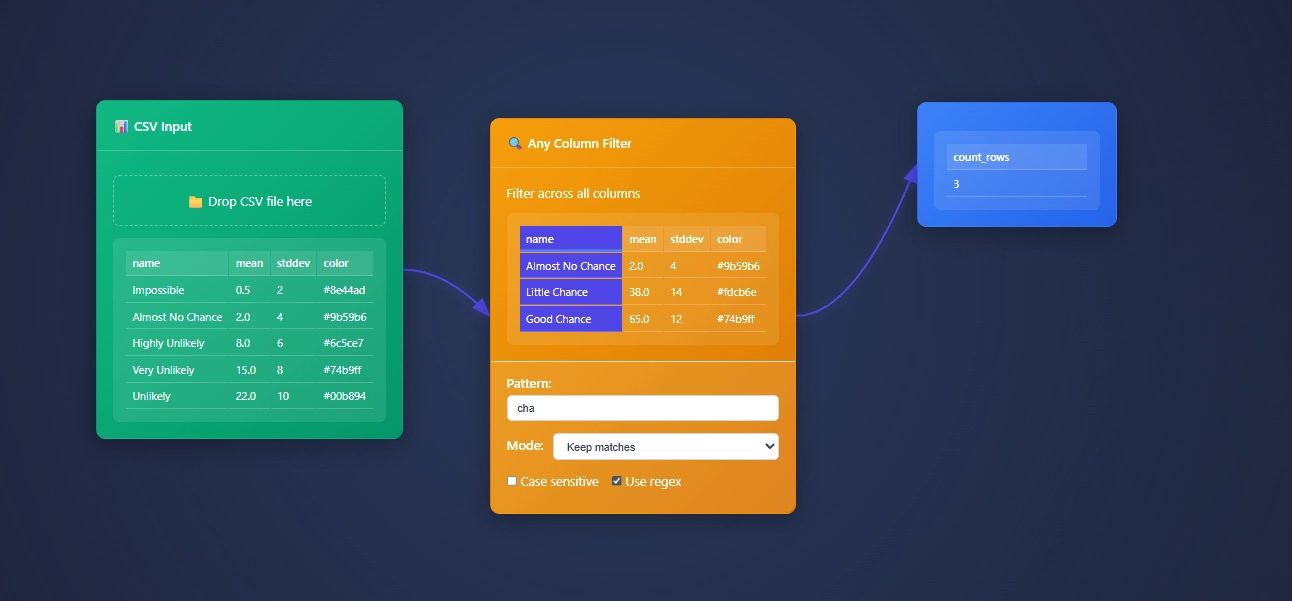
ET1 is a visual data workbench that lets you explore, clean, and explain data solutions.


- Access ET1
- Unlock 24 nodes
- Free ETL software
- Desktop friendly
- Code on GitHub iCore utilities, UI pieces, and node definitions live in the public repository so you can review how processing works.
- No storage
- ET1.1 + GitHub OAuth
- Unlock 29 nodes
- Workflows + Neon LakeiNeon Lake is the persistent store for workflow data and results. The free tier has no storage. This tier includes limited storage and 1 branch.
- 100/CU-monthiCU = Compute Unit. An internal measure we use to track processing cost across transforms.
- 500 MB storageiStorage in Neon Lake for tables and results. Retention policies may apply while we tune usage.
- 1 BranchiThis tier includes a single branch only.
- ET1.1 + GitHub OAuth
- Unlock 29 nodes
- Workflows + Neon Lake
- $0.28/CU-houriMetered compute beyond included quota. Priced per compute-hour equivalent derived from CU usage.
- $0.46/GB-monthiNeon Lake storage billed by logical GB-month. We may introduce archival tiers.
- 3 BranchesiEach branch has isolated CPU and storage. You only pay for the delta (the difference) between branches.
- SOC 2 • HIPAA • GDPR
- Regional locations
- User-level pricing
- $0.52/CU-hour
- $0.49/GB-month
- 10 Branches
- Unlimited databases & tables
Training Documentation
Use the training material to help you understand more about ET1 and how it helps solve data wrangling problems.

ET1 Basic Training
If you need help getting started, begin here.

ET1 Video Training
Learn the basics, the features, and more.
Future Insight
We see the future being focused on adoption, training, and creating Easy Tools for anyone. We are building an emerging technology while also maintaining a creative user experience that is inviting and friendly for all ages.
Inspiration
We are inspired by software, video games, and Sci-Fi movies like The Matrix, Minority Report and Ironman.
Join beta.
Why do you want to access beta?
Mixed Reality Data Rooms: Immersive Analytics Collaboration
Imagine stepping into your data rather than merely observing it. Mixed Reality (MR) is reshaping industries—including data analytics—by transforming the static views of traditional data visualization into immersive, collaborative virtual spaces. Leaders equipped with...
Command Pattern: Implementing Undo / Redo in Pipelines
Imagine building a robust data pipeline framework where every change counts. Like an expert chess player who plans ahead, a modern tech leader needs confidence that each move can be unmistakably tracked, reversed, or reinstated. For those in charge of complex...
Tensor Ops at Scale: Crunching Multidimensional Arrays
In today's hyper-competitive digital landscape, swiftly managing and analyzing complex datasets is not just advantageous—it's essential. Organizations increasingly leverage multidimensional arrays, or tensors, to tackle large-scale data analytics, predictive modeling,...
Context Propagation: Maintaining State Across Boundaries
In today's digital ecosystem—where data, analytics, and innovation blend to shape critical business decisions—the concept of maintaining context across systems, APIs, and service boundaries has never been so compellingly significant. Imagine orchestrating an extensive...
Factory Pattern: Injecting Dynamic Processing Logic
In an era where flexibility and agility are the cornerstones of competitive advantage in data-driven businesses, software architectures need to evolve beyond rigid designs. To strategically manage complexity, we must employ designs that empower our systems to...
Complex Event Processing: Detecting Patterns in Streaming Flow
Imagine standing beside a massive digital river where millions of data points flow continuously and swiftly every second. Each data point marks an exact moment, carrying critical insights vital for businesses to stay competitive, adaptive, and innovative. Enter...
Repository Pattern: Clean Data Access Layers
In today's high-speed tech landscape, your data strategy directly impacts your ability to innovate. As your organization scales, ensuring clean, maintainable code and efficient data access becomes critical for driving accurate insights and informed decisions. Enter...
Graphs at Scale: Adjacency Lists vs. Matrices Revisited
In the current era of big data and complex interconnected systems, graph analytics plays an increasingly critical role in understanding the nuanced relationships within data. As businesses grapple with more extensive, intricate systems and data sets, the method you...
Ports & Adapters: Going Hexagonal with Your Pipeline
In today's digitally connected economy, your data pipeline is not simply an operational asset—it is the lifeblood of informed decisions, innovation, and competitive advantage. Yet many organizations continue to grapple with monolithic pipeline architectures that...
Features of Today()+1
Available Now()


