Uncomplicate Data
Create end-to-end data analytics solutions in one app that is simple to use, and self-explanatory.
About ET1
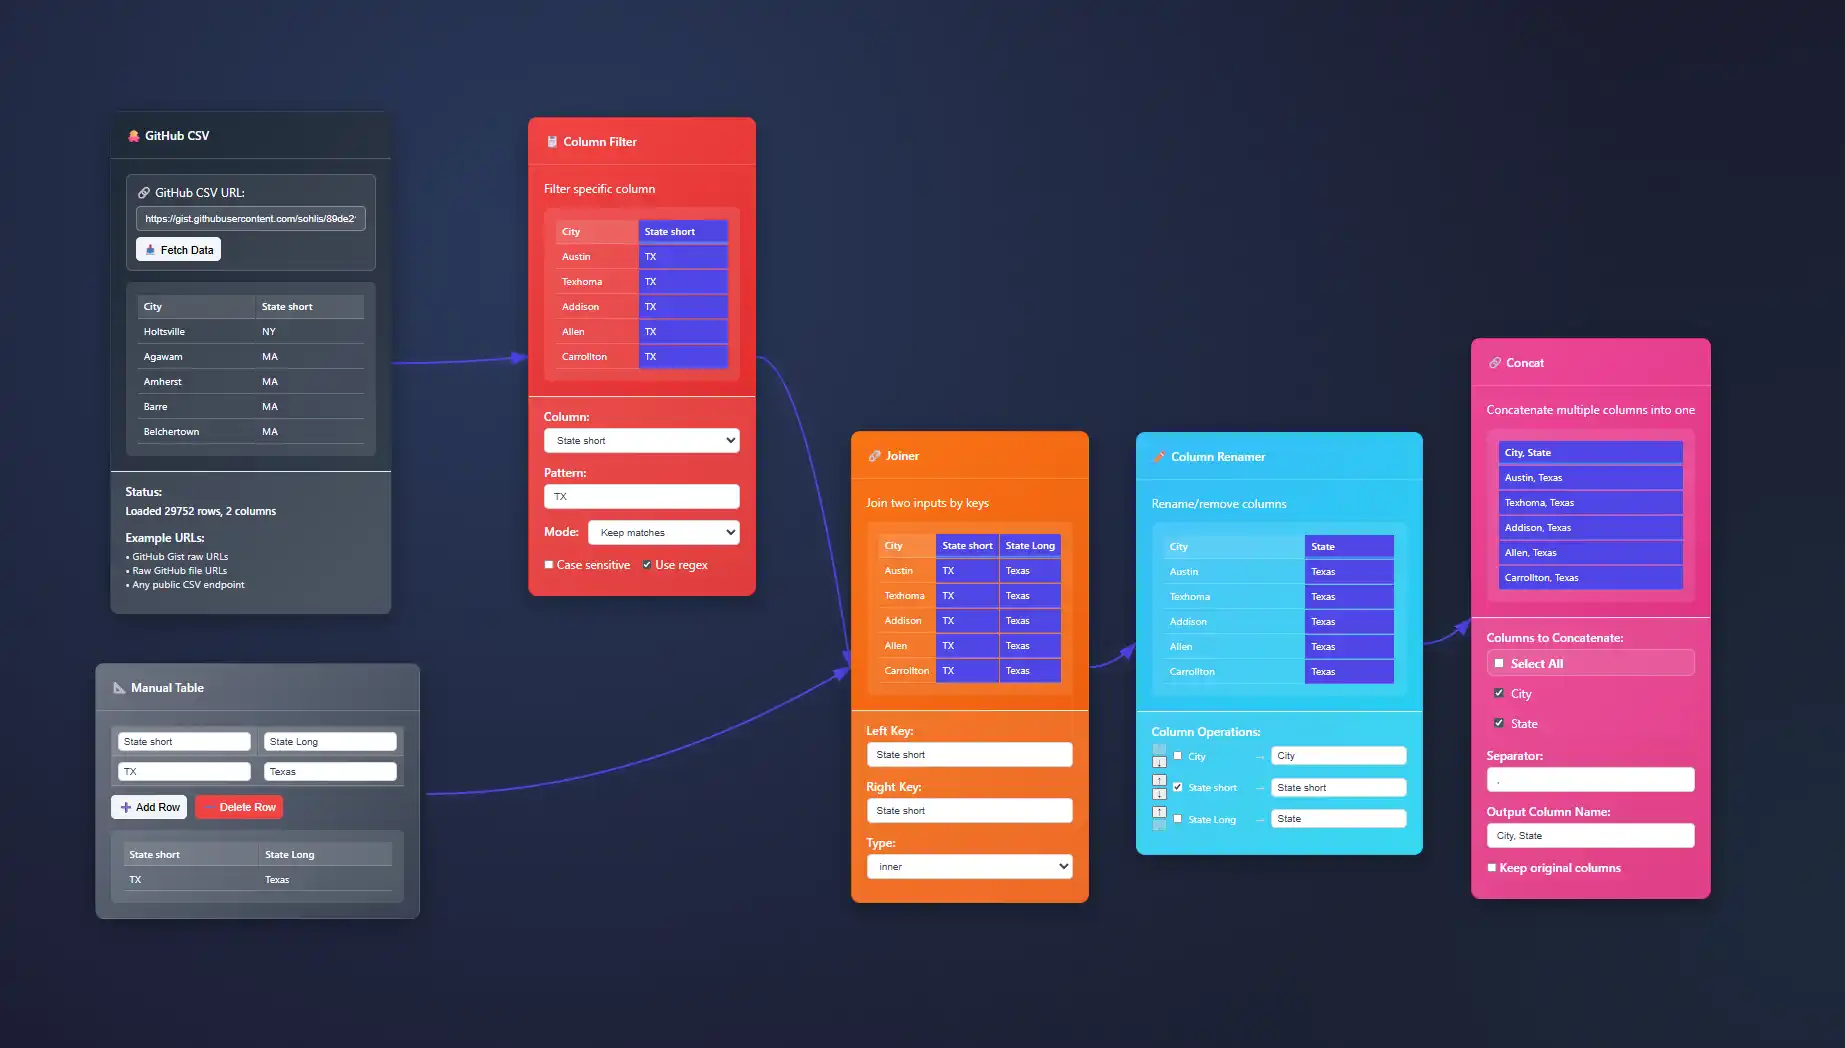
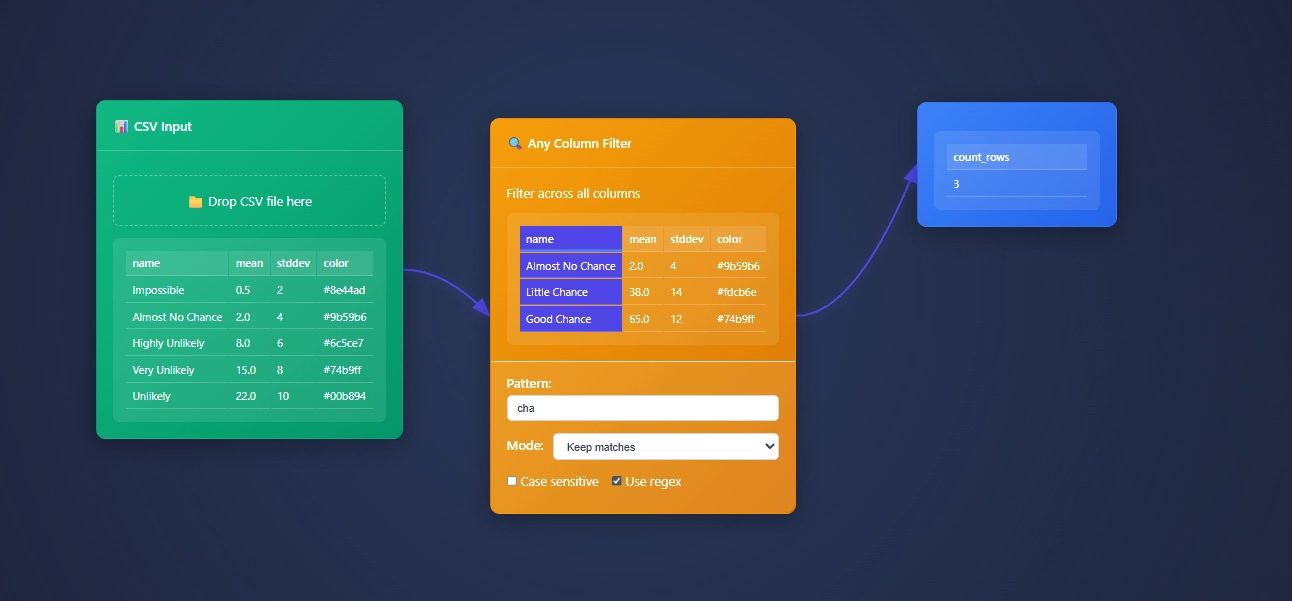
ET1 is a visual data workbench that lets you explore, clean, and explain data solutions.


- Access ET1
- Unlock 24 nodes
- Free ETL software
- Desktop friendly
- Code on GitHub iCore utilities, UI pieces, and node definitions live in the public repository so you can review how processing works.
- No storage
- ET1.1 + GitHub OAuth
- Unlock 29 nodes
- Workflows + Neon LakeiNeon Lake is the persistent store for workflow data and results. The free tier has no storage. This tier includes limited storage and 1 branch.
- 100/CU-monthiCU = Compute Unit. An internal measure we use to track processing cost across transforms.
- 500 MB storageiStorage in Neon Lake for tables and results. Retention policies may apply while we tune usage.
- 1 BranchiThis tier includes a single branch only.
- ET1.1 + GitHub OAuth
- Unlock 29 nodes
- Workflows + Neon Lake
- $0.28/CU-houriMetered compute beyond included quota. Priced per compute-hour equivalent derived from CU usage.
- $0.46/GB-monthiNeon Lake storage billed by logical GB-month. We may introduce archival tiers.
- 3 BranchesiEach branch has isolated CPU and storage. You only pay for the delta (the difference) between branches.
- SOC 2 • HIPAA • GDPR
- Regional locations
- User-level pricing
- $0.52/CU-hour
- $0.49/GB-month
- 10 Branches
- Unlimited databases & tables
Training Documentation
Use the training material to help you understand more about ET1 and how it helps solve data wrangling problems.

ET1 Basic Training
If you need help getting started, begin here.

ET1 Video Training
Learn the basics, the features, and more.
Future Insight
We see the future being focused on adoption, training, and creating Easy Tools for anyone. We are building an emerging technology while also maintaining a creative user experience that is inviting and friendly for all ages.
Inspiration
We are inspired by software, video games, and Sci-Fi movies like The Matrix, Minority Report and Ironman.
Join beta.
Why do you want to access beta?
Cruise Industry Analytics: Passenger Experience Visualization
Imagine captaining your cruise line forward with remarkable precision—leveraging deep insights into passenger experience to transform every voyage into a tailored journey of delight. The cruising business sails smoothly only when operators seamlessly anticipate and...
Agricultural Commodity Analytics: Crop Yield Prediction Visualization
In today’s hyper-competitive agricultural landscape, accurate crop yield prediction is no longer optional—it's a strategic necessity. Advanced commodity analytics and visualization have emerged as vital technological allies allowing agribusinesses to proactively...
Corporate Merger Analytics: Due Diligence Visualization Tools
Mergers and acquisitions (M&A) continue to reshape markets and redefine competitive dynamics. However, the grim reality is that up to two-thirds of all mergers fail to meet their original objectives due to insufficient due diligence and unclear visibility of...
Renewable Energy Analytics: Solar and Wind Performance Dashboards
Harnessing renewable energy is crucial in today's energy landscape, yet understanding the performance quality and gaps of solar panels and wind turbines can pose challenges for organizations without robust analytics. Solar and wind performance dashboards represent a...
Drone Imagery Analytics: Aerial Data Visualization Platforms
Today's decision-makers stand atop a mountain of data, yet the most transformative insights often emerge from above—literally. Drone imagery analytics is changing the landscape of data-driven decisions across industries from agriculture to construction, providing...
Space Debris Tracking: Orbital Visualization and Collision Prediction
In the digital age of satellite-dependent communications, navigation, and global operations, the reality of space debris represents an accelerating risk factor. From defunct satellites and rocket stages to remnants of space missions past, an estimated millions of...
Pandemic Preparedness Analytics: Disease Spread Visualization Models
The global pandemic has dramatically underscored the critical need for advanced analytics and visualization tools in managing health crises. Decision-makers must rely on accurate forecasting, timely insights, and clear visualizations to act promptly and effectively....
Multi-Cloud Cost Visualization: Optimizing Spend Across Providers
In today's increasingly complex technology landscape, organizations rely heavily on multi-cloud architectures to stay agile, scalable, and competitive. With workloads spread across a variety of cloud providers such as AWS, Azure, and Google Cloud Platform, keeping...
Corporate Sustainability Analytics: Carbon Footprint Visualization
Today's forward-thinking companies have embraced sustainable practices as a cornerstone of their growth and brand identity. But sustainability isn't simply about setting goals—it's about effectively measuring and communicating the impact of your initiatives. With...
Features of Today()+1
Available Now()


