Uncomplicate Data
Create end-to-end data analytics solutions in one app that is simple to use, and self-explanatory.
About ET1
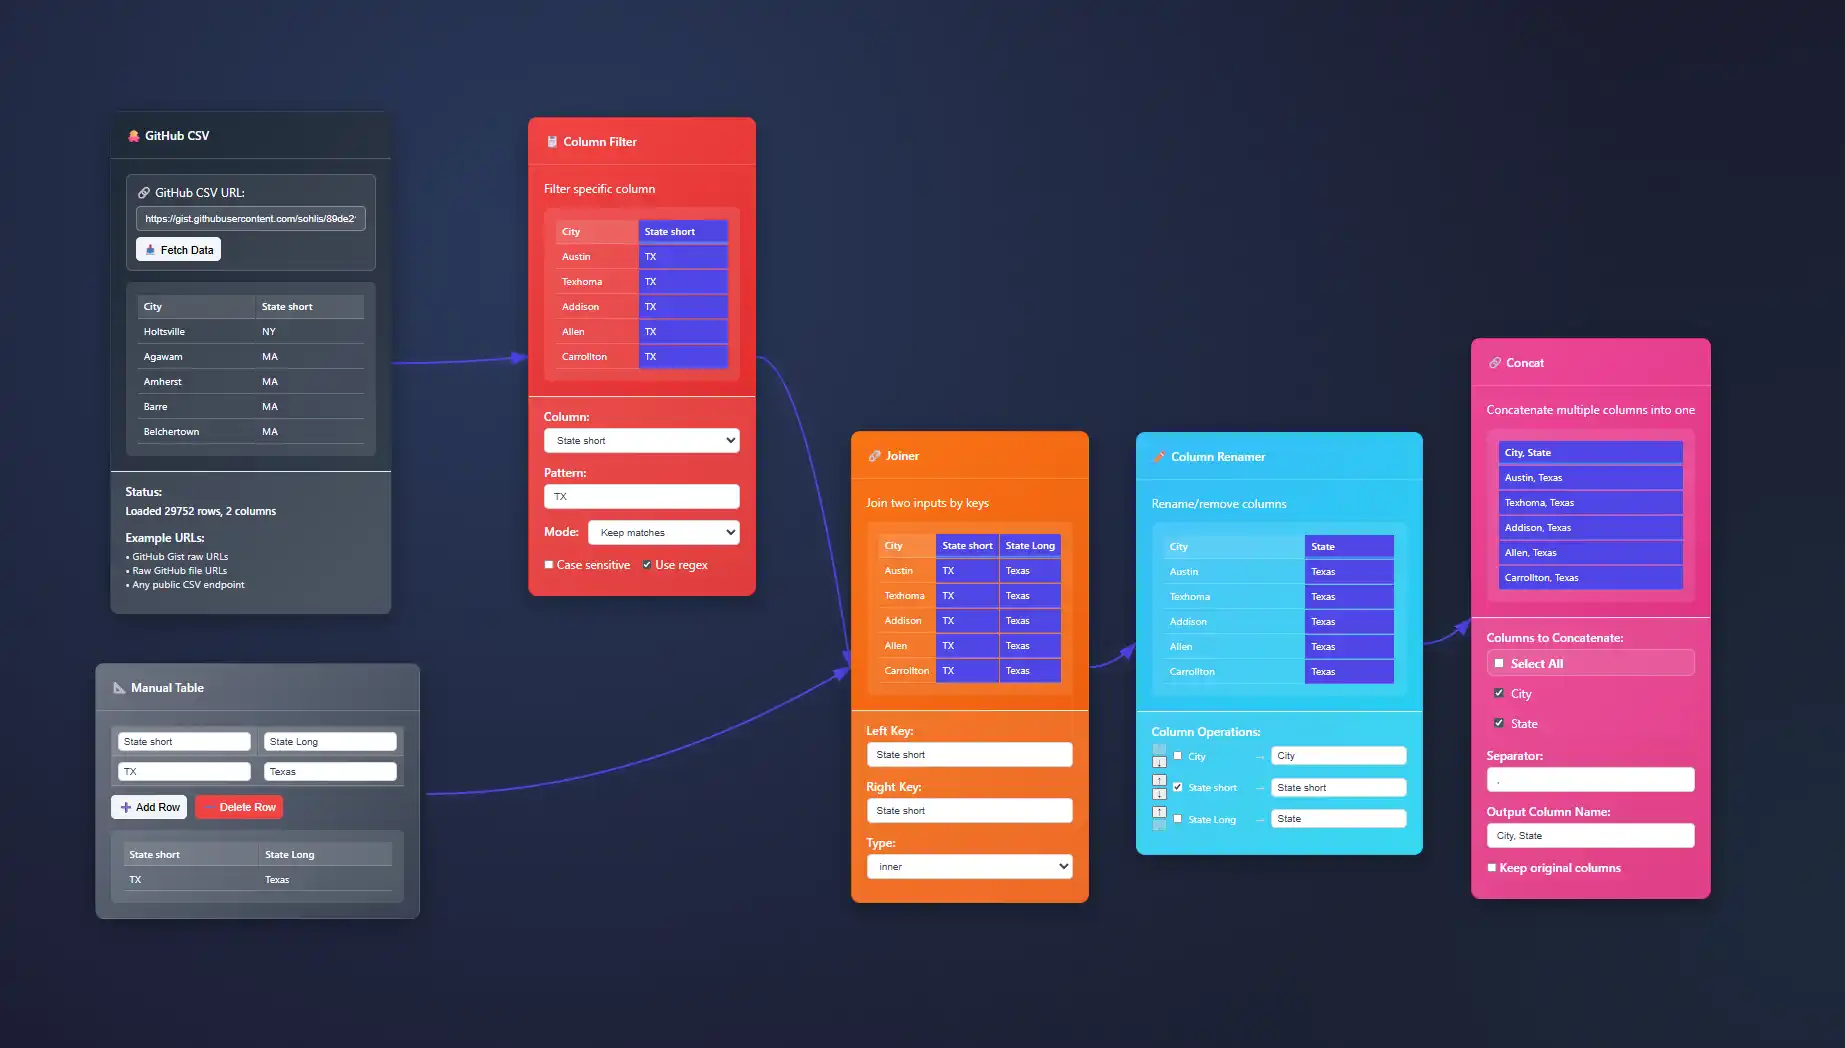
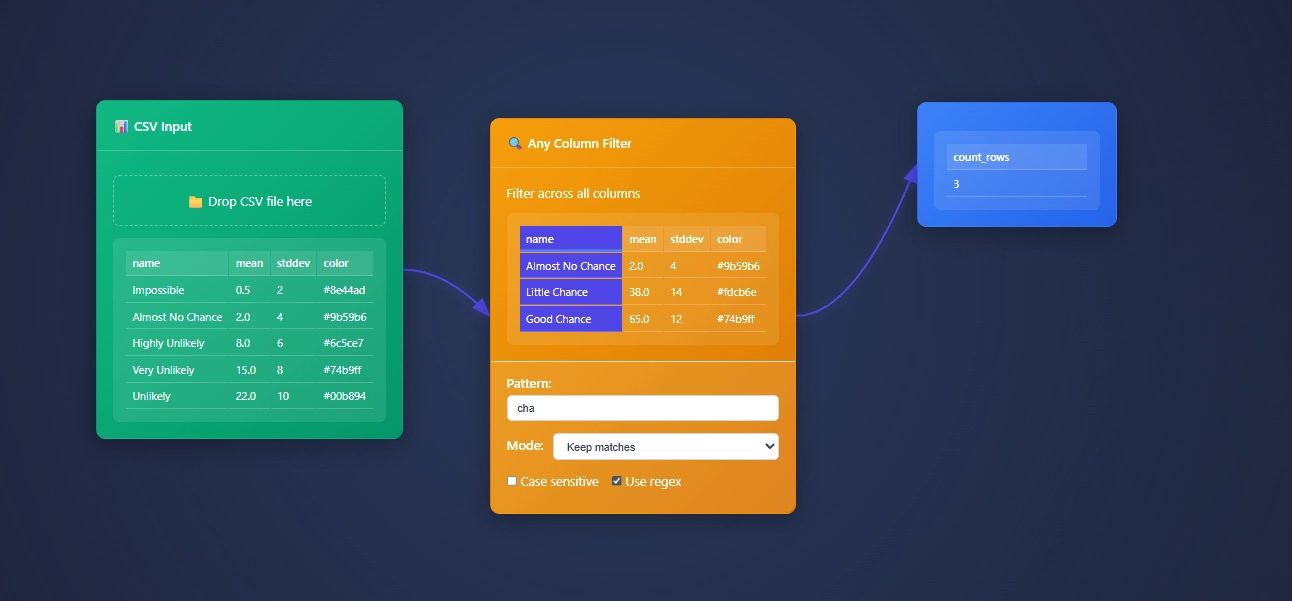
ET1 is a visual data workbench that lets you explore, clean, and explain data solutions.


- Access ET1
- Unlock 24 nodes
- Free ETL software
- Desktop friendly
- Code on GitHub iCore utilities, UI pieces, and node definitions live in the public repository so you can review how processing works.
- No storage
- ET1.1 + GitHub OAuth
- Unlock 29 nodes
- Workflows + Neon LakeiNeon Lake is the persistent store for workflow data and results. The free tier has no storage. This tier includes limited storage and 1 branch.
- 100/CU-monthiCU = Compute Unit. An internal measure we use to track processing cost across transforms.
- 500 MB storageiStorage in Neon Lake for tables and results. Retention policies may apply while we tune usage.
- 1 BranchiThis tier includes a single branch only.
- ET1.1 + GitHub OAuth
- Unlock 29 nodes
- Workflows + Neon Lake
- $0.28/CU-houriMetered compute beyond included quota. Priced per compute-hour equivalent derived from CU usage.
- $0.46/GB-monthiNeon Lake storage billed by logical GB-month. We may introduce archival tiers.
- 3 BranchesiEach branch has isolated CPU and storage. You only pay for the delta (the difference) between branches.
- SOC 2 • HIPAA • GDPR
- Regional locations
- User-level pricing
- $0.52/CU-hour
- $0.49/GB-month
- 10 Branches
- Unlimited databases & tables
Training Documentation
Use the training material to help you understand more about ET1 and how it helps solve data wrangling problems.

ET1 Basic Training
If you need help getting started, begin here.

ET1 Video Training
Learn the basics, the features, and more.
Future Insight
We see the future being focused on adoption, training, and creating Easy Tools for anyone. We are building an emerging technology while also maintaining a creative user experience that is inviting and friendly for all ages.
Inspiration
We are inspired by software, video games, and Sci-Fi movies like The Matrix, Minority Report and Ironman.
Join beta.
Why do you want to access beta?
Airline Operations Analytics: Flight Optimization Visualization Tools
In the fast-paced world of airline operations, achieving peak efficiency means not only saving substantial costs but also improving the traveler experience and environmental impact. Flight optimization visualization tools offer airlines a crucial advantage,...
Genomics Data Visualization: DNA Sequence Analysis Platforms
In today's competitive biotech landscape, effective interpretation and visualization of genomics data acts as the bedrock for breakthroughs in personalized medicine, agriculture innovation, and bioinformatics research. DNA sequencing platforms generate massive...
Social Media Influence Mapping: Digital Authority Visualization
In an era dominated by digital interactions and online visibility, decision-makers across industries must gain clarity into social media landscapes to better understand influence, trends, and digital authority. Social media influence mapping has emerged as a powerful...
Weather Prediction Visualization: Meteorological Model Dashboards
In an era where data-driven decisions can make or break critical business outcomes, understanding how to effectively visualize weather prediction data is no longer optional—it's essential. The complexity of meteorological models demands sophisticated analytics...
Immigration Data Analytics: Population Movement Visualization Systems
Immigration continues to reshape the demographics, economies, and cultures of societies globally. Understanding population movement trends has become more significant than ever, driven by technological innovations and advanced analytics. Data-driven decisions...
Auction House Analytics: Art Market Visualization Platforms
The global art market—characterized by its allure, complexity, and opaqueness—has long fascinated collectors, investors, and industry analysts alike. Yet, until recently, navigating this marketplace demanded immense experience, intuition, and connectivity. Today,...
Water Resource Management: Hydrology Data Visualization Tools
Water sustains life, propels economies, and shapes the very fabric of civilizations. However, ensuring it's consistently available—clean, safe, and abundant—requires strategic management built on solid data-driven insights. Hydrology data visualization tools empower...
Nuclear Facility Monitoring: Radiation Data Visualization Systems
Visual analytics transform abstract radiation data into actionable insights, empowering nuclear facility leaders to confidently monitor and manage safety. Effective radiation data visualization is paramount—not just a luxury, but an essential measure. Accurately...
Voice of Customer Visualization: Real-Time Feedback Dashboards
In the era of unprecedented data generation, organizations that capture, understand, and quickly act on customer feedback gain a strategic advantage. Today's customers interact with businesses through numerous digital touchpoints, from social media to customer service...
Features of Today()+1
Available Now()


