Uncomplicate Data
Create end-to-end data analytics solutions in one app that is simple to use, and self-explanatory.
About ET1
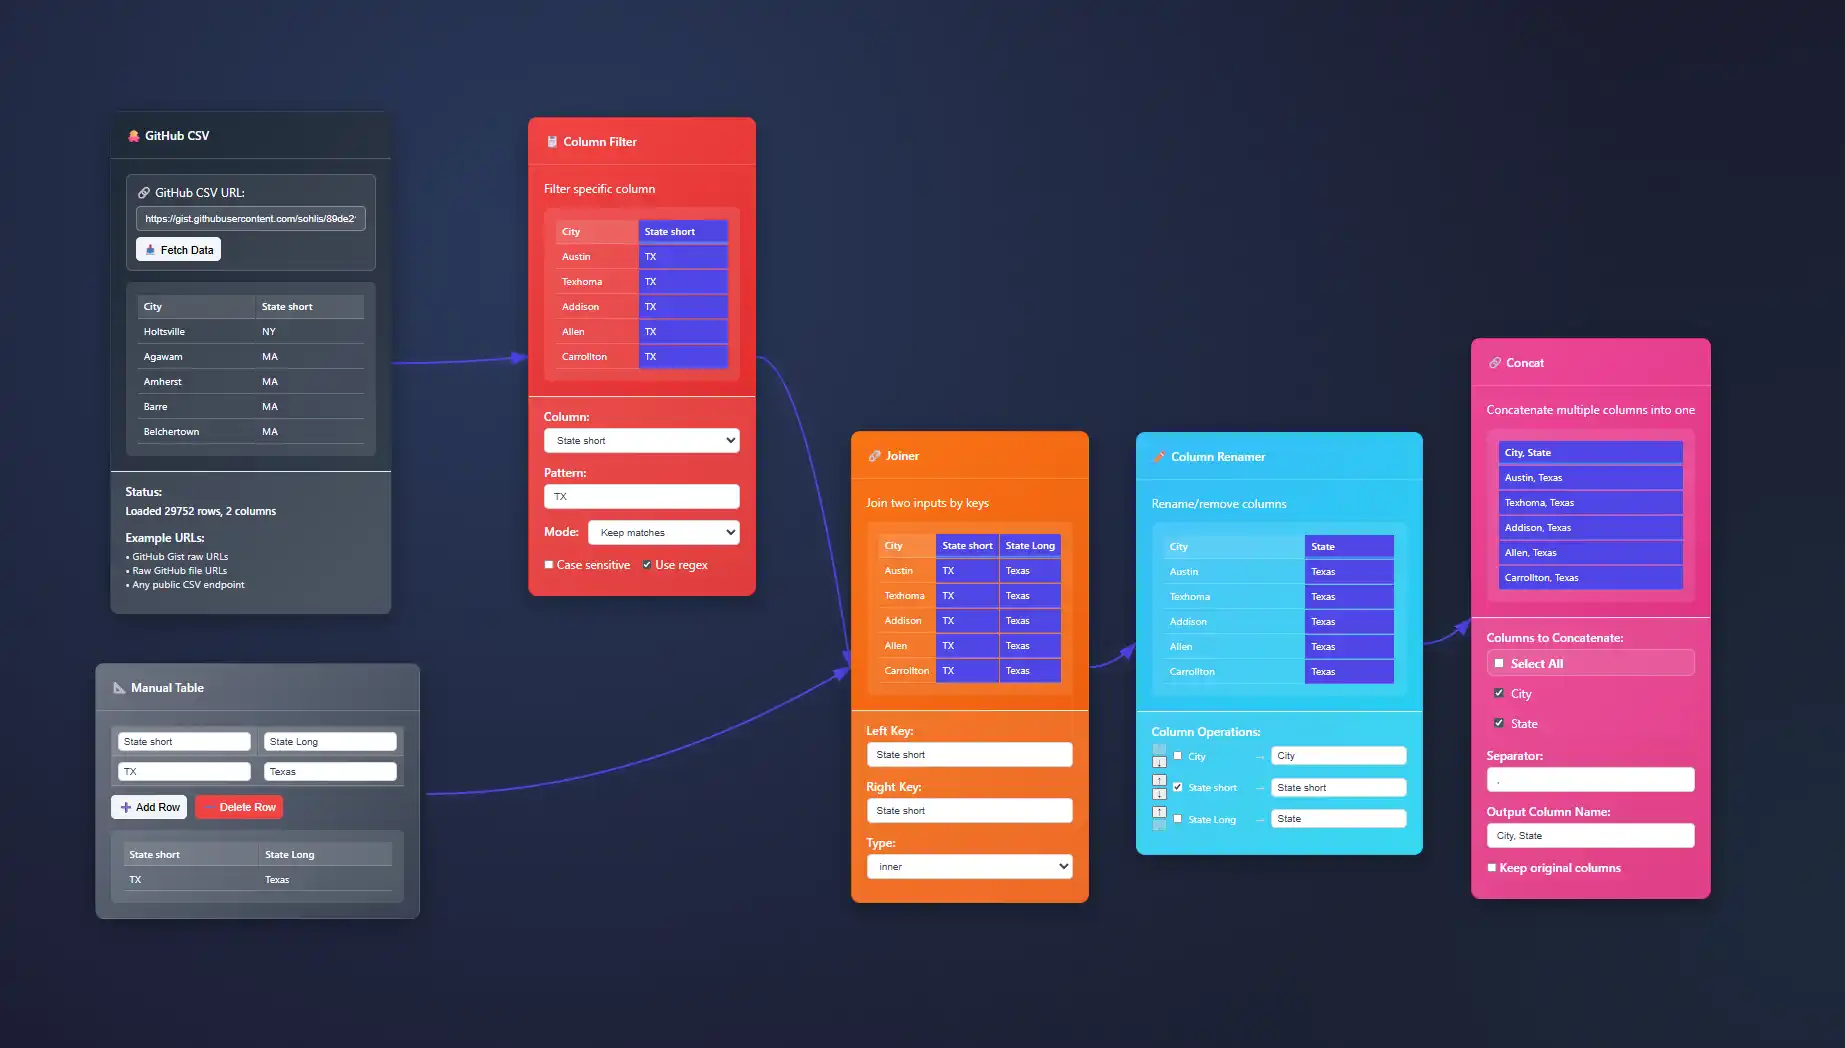
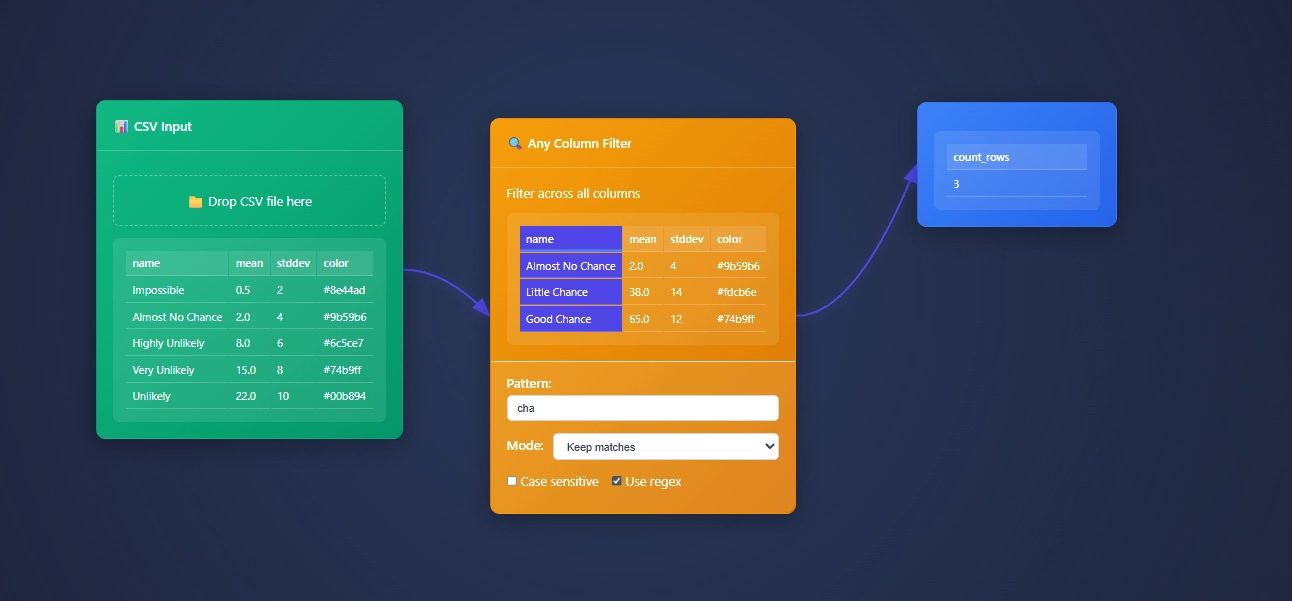
ET1 is a visual data workbench that lets you explore, clean, and explain data solutions.


- Access ET1
- Unlock 24 nodes
- Free ETL software
- Desktop friendly
- Code on GitHub iCore utilities, UI pieces, and node definitions live in the public repository so you can review how processing works.
- No storage
- ET1.1 + GitHub OAuth
- Unlock 29 nodes
- Workflows + Neon LakeiNeon Lake is the persistent store for workflow data and results. The free tier has no storage. This tier includes limited storage and 1 branch.
- 100/CU-monthiCU = Compute Unit. An internal measure we use to track processing cost across transforms.
- 500 MB storageiStorage in Neon Lake for tables and results. Retention policies may apply while we tune usage.
- 1 BranchiThis tier includes a single branch only.
- ET1.1 + GitHub OAuth
- Unlock 29 nodes
- Workflows + Neon Lake
- $0.28/CU-houriMetered compute beyond included quota. Priced per compute-hour equivalent derived from CU usage.
- $0.46/GB-monthiNeon Lake storage billed by logical GB-month. We may introduce archival tiers.
- 3 BranchesiEach branch has isolated CPU and storage. You only pay for the delta (the difference) between branches.
- SOC 2 • HIPAA • GDPR
- Regional locations
- User-level pricing
- $0.52/CU-hour
- $0.49/GB-month
- 10 Branches
- Unlimited databases & tables
Training Documentation
Use the training material to help you understand more about ET1 and how it helps solve data wrangling problems.

ET1 Basic Training
If you need help getting started, begin here.

ET1 Video Training
Learn the basics, the features, and more.
Future Insight
We see the future being focused on adoption, training, and creating Easy Tools for anyone. We are building an emerging technology while also maintaining a creative user experience that is inviting and friendly for all ages.
Inspiration
We are inspired by software, video games, and Sci-Fi movies like The Matrix, Minority Report and Ironman.
Join beta.
Why do you want to access beta?
Bridge Pattern: Integrating Heterogeneous Systems
In today's technology landscape, enterprises face a constant influx of diverse systems, each developed independently, bringing their unique languages, data structures, and communication protocols. This heterogeneity offers innovation opportunities, yet simultaneously...
Histogram Analytics: Distribution Insights at Scale
Imagine harnessing the massive data flow your enterprise produces daily, capturing meaningful insights quickly, and being equipped to react strategically. Histogram analytics makes this achievable, offering a robust statistical toolkit designed for scale—enabling...
Composite Pattern: Navigating Nested Structures
In the fast-paced world of software engineering, mastering the complexity inherent in software architecture is crucial to building robust applications and unleashing innovative potential. One of the strongest allies developers have to tame this complexity is known as...
Fuzzy Joins: Handling Approximate Matches
In the dynamic and fast-moving landscape of modern analytics and data-driven insights, precision isn't always black-and-white. Often, we find ourselves grappling with data sets that don't match neatly, confronting subtle variations and messy inconsistencies buried...
Decorator Pattern: Building Layered Transformations
In today's fast-paced data-driven business environment, software development often involves meeting evolving and increasingly sophisticated requirements. Decision-makers require flexible approaches that empower their teams to rapidly adapt software structures without...
Differential Computation: Deltas Done Efficiently
In today's fast-paced, data-driven world, businesses rely on real-time insights to make informed decisions. Every minute, massive amounts of data flow into systems, and conventional methods of updating entire datasets become increasingly impractical and expensive....
Strategy Pattern: Swapping Algorithms on the Fly
Imagine your business has expanded rapidly, data is flowing in faster than ever before, and you suddenly find your traditional algorithms bogging down under new constraints. Picture the ability to seamlessly swap out functionality in your software, changing algorithms...
End-to-End Lineage: Visualizing Transformations
The era of big data is upon us, and in this digital landscape, data governance and traceability aren't optional—they're essential. Today’s enterprises grapple with immense complexity as their data journeys across countless integrations, transformations, and pipelines....
Edge Computing Data Visualization: Insights at the Network Edge
Imagine transforming an overwhelming sea of data into actionable insights right where it's generated. Traditionally, data has journeyed long distances—from user devices to centralized data warehousing—for analysis. However, edge computing paired with powerful...
Features of Today()+1
Available Now()


