Uncomplicate Data
Create end-to-end data analytics solutions in one app that is simple to use, and self-explanatory.
About ET1
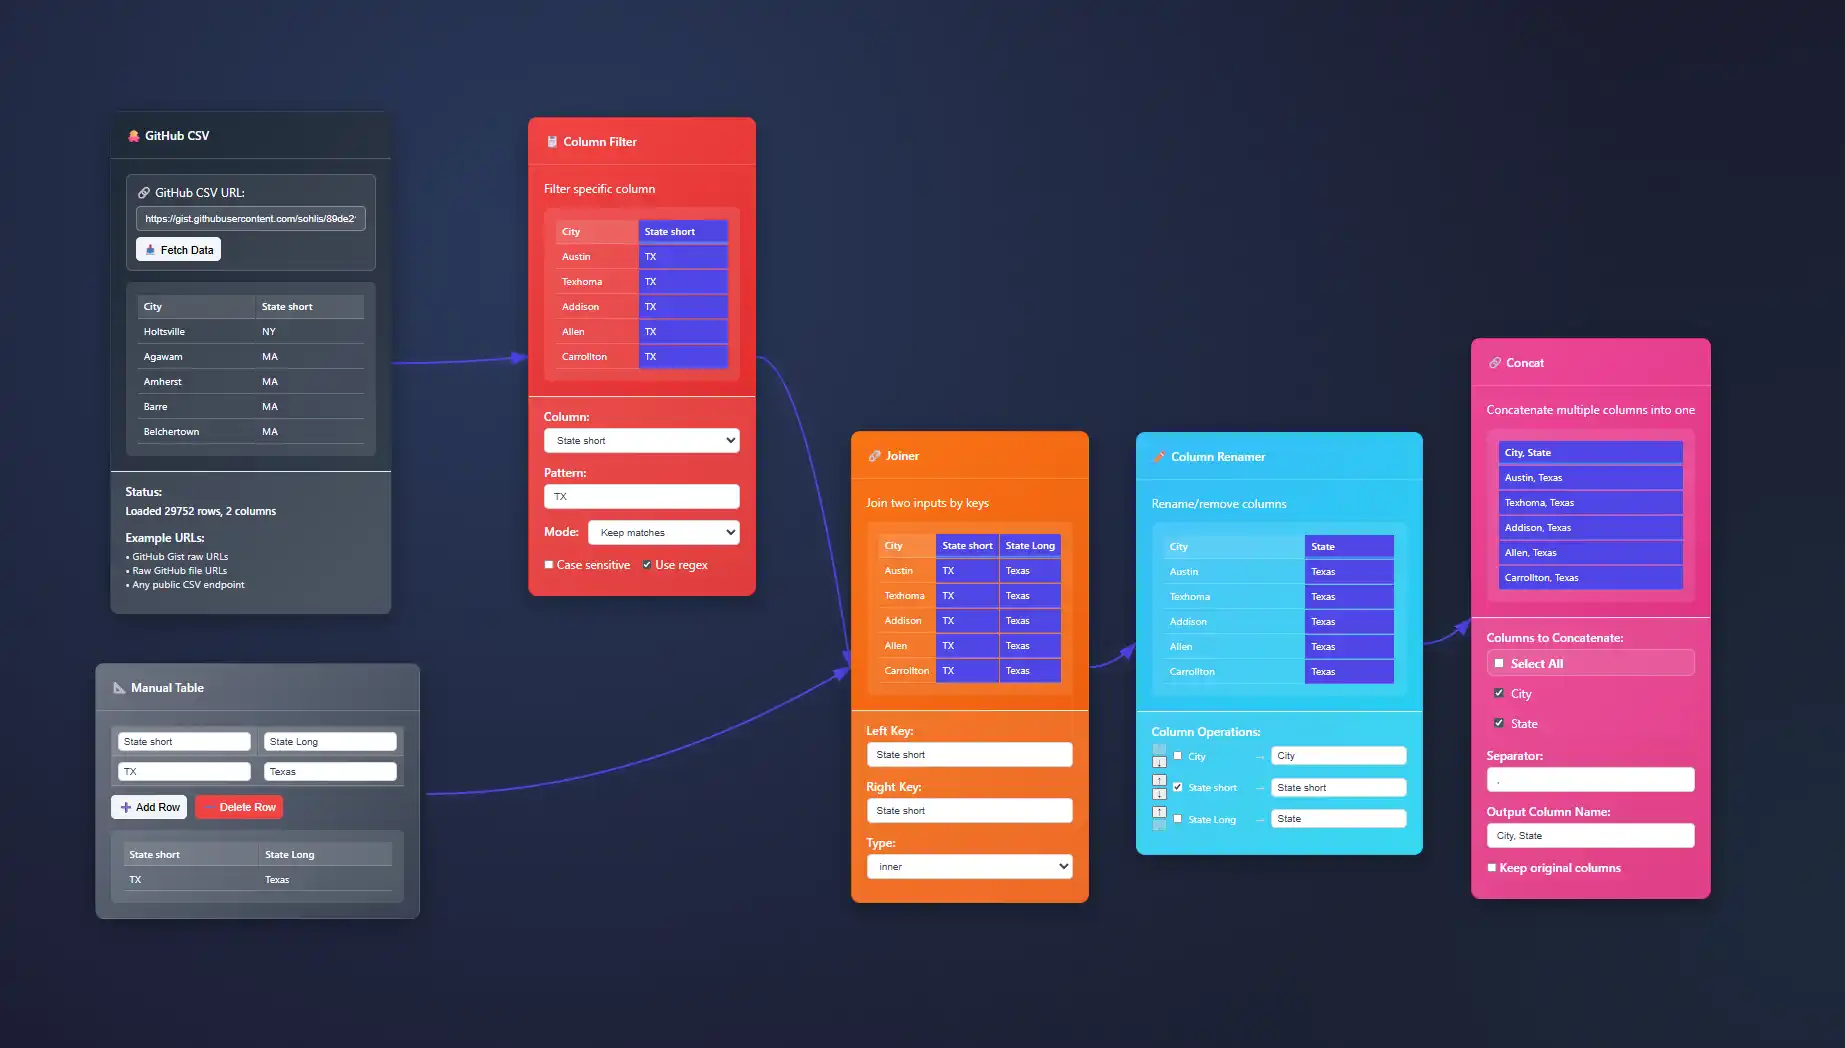
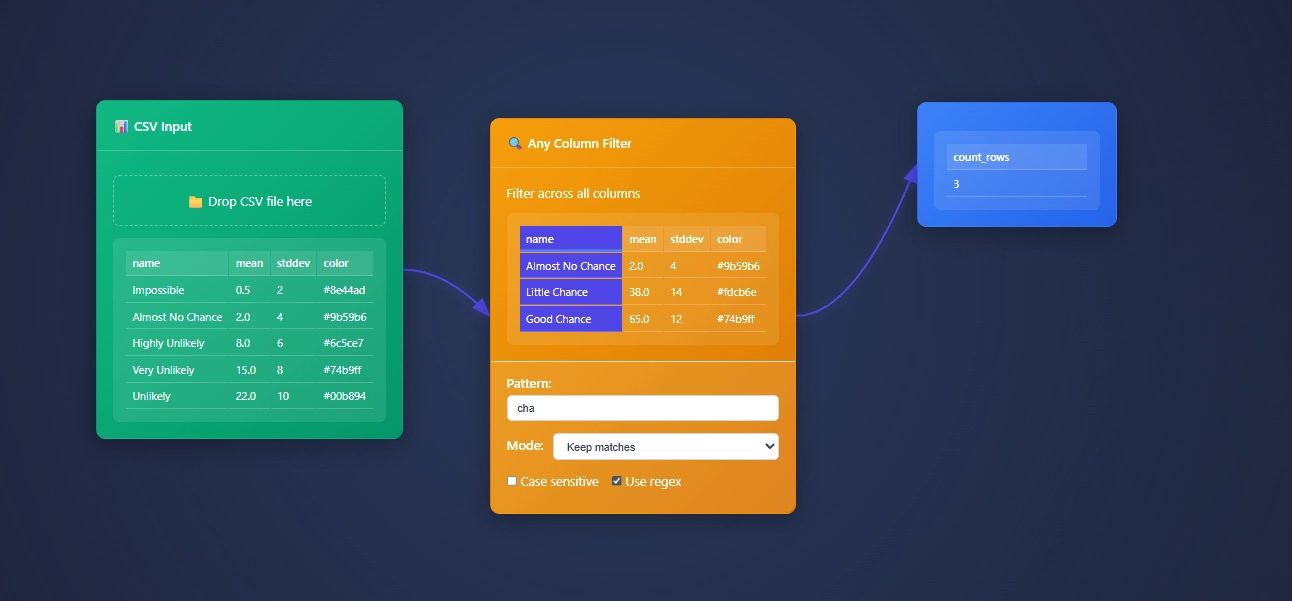
ET1 is a visual data workbench that lets you explore, clean, and explain data solutions.


- Access ET1
- Unlock 24 nodes
- Free ETL software
- Desktop friendly
- Code on GitHub iCore utilities, UI pieces, and node definitions live in the public repository so you can review how processing works.
- No storage
- ET1.1 + GitHub OAuth
- Unlock 29 nodes
- Workflows + Neon LakeiNeon Lake is the persistent store for workflow data and results. The free tier has no storage. This tier includes limited storage and 1 branch.
- 100/CU-monthiCU = Compute Unit. An internal measure we use to track processing cost across transforms.
- 500 MB storageiStorage in Neon Lake for tables and results. Retention policies may apply while we tune usage.
- 1 BranchiThis tier includes a single branch only.
- ET1.1 + GitHub OAuth
- Unlock 29 nodes
- Workflows + Neon Lake
- $0.28/CU-houriMetered compute beyond included quota. Priced per compute-hour equivalent derived from CU usage.
- $0.46/GB-monthiNeon Lake storage billed by logical GB-month. We may introduce archival tiers.
- 3 BranchesiEach branch has isolated CPU and storage. You only pay for the delta (the difference) between branches.
- SOC 2 • HIPAA • GDPR
- Regional locations
- User-level pricing
- $0.52/CU-hour
- $0.49/GB-month
- 10 Branches
- Unlimited databases & tables
Training Documentation
Use the training material to help you understand more about ET1 and how it helps solve data wrangling problems.

ET1 Basic Training
If you need help getting started, begin here.

ET1 Video Training
Learn the basics, the features, and more.
Future Insight
We see the future being focused on adoption, training, and creating Easy Tools for anyone. We are building an emerging technology while also maintaining a creative user experience that is inviting and friendly for all ages.
Inspiration
We are inspired by software, video games, and Sci-Fi movies like The Matrix, Minority Report and Ironman.
Join beta.
Why do you want to access beta?
Political Campaign Analytics: Voter Behavior Visualization Systems
The political battlefield has undeniably shifted toward data-driven decisions. Understanding voter behavior is no longer just about surveys and polls; it's about leveraging sophisticated analytics tools and visualization systems to reveal hidden insights. At a time...
Space Mission Data Visualization: Astronomical Analytics Platforms
Space exploration and astronomy have always fascinated humanity, driven breakthroughs, and created immense volumes of data. Just as telescopes expanded our view of stars and galaxies, modern analytics platforms are revolutionizing our understanding through interactive...
Marine Biology Analytics: Ocean Data Visualization Tools
The oceans represent the unexplored frontier of our planet, holding mysteries vital to life—and our survival on Earth. Today, oceanographic discoveries are increasingly driven not by manual labor alone, but by advanced analytics and data visualization technologies....
Cryptocurrency Trading Visualization: DeFi Protocol Analysis
In the ever-transforming landscape of cryptocurrency trading, Decentralized Finance (DeFi) has emerged as the most intriguing and impactful revolution yet. Unlike traditional financial systems, DeFi protocols are operated without intermediaries, governed instead by...
Autonomous Vehicle Analytics: Self-Driving Car Data Visualization
In today's rapidly evolving transportation landscape, autonomous vehicles are no longer a distant vision but a tangible reality reshaping our roads. As fleets of self-driving cars increasingly navigate our cities, they generate vast amounts of sophisticated data that...
Mental Health Analytics: Therapy Outcome Visualization Systems
Imagine a future where mental healthcare is data-informed, precise, and visually insightful. Where psychological progress isn't just an abstract feeling but charted clearly in interactive visualizations and predictive analytics tools. From therapists juggling busy...
Restaurant Analytics Dashboards: Food Service Optimization Tools
The restaurant and food service industry is evolving rapidly, driven by growing consumer expectations, increased competition, and the quest to maximize profitability in an uncertain economy. To stay competitive, savvy restaurateurs and hospitality managers are...
Fashion Industry Analytics: Trend Prediction Visualization Platforms
Picture a world where your brand anticipates fashion trends months before they become mainstream—where your business decisions are driven not by guesswork, but by rich visualizations of detailed analytics. Fashion analytics, powered by innovative data visualization...
Entropy Metrics: Measuring Information Content in Datasets
The digital era has ushered in enormous volumes of data, pulsating through the veins of modern organizations as the lifeblood of informed decision-making. Yet not all data shares an equal weight—some is rich with actionable insights, while other datasets offer little...
Features of Today()+1
Available Now()


