Uncomplicate Data
Create end-to-end data analytics solutions in one app that is simple to use, and self-explanatory.
About ET1
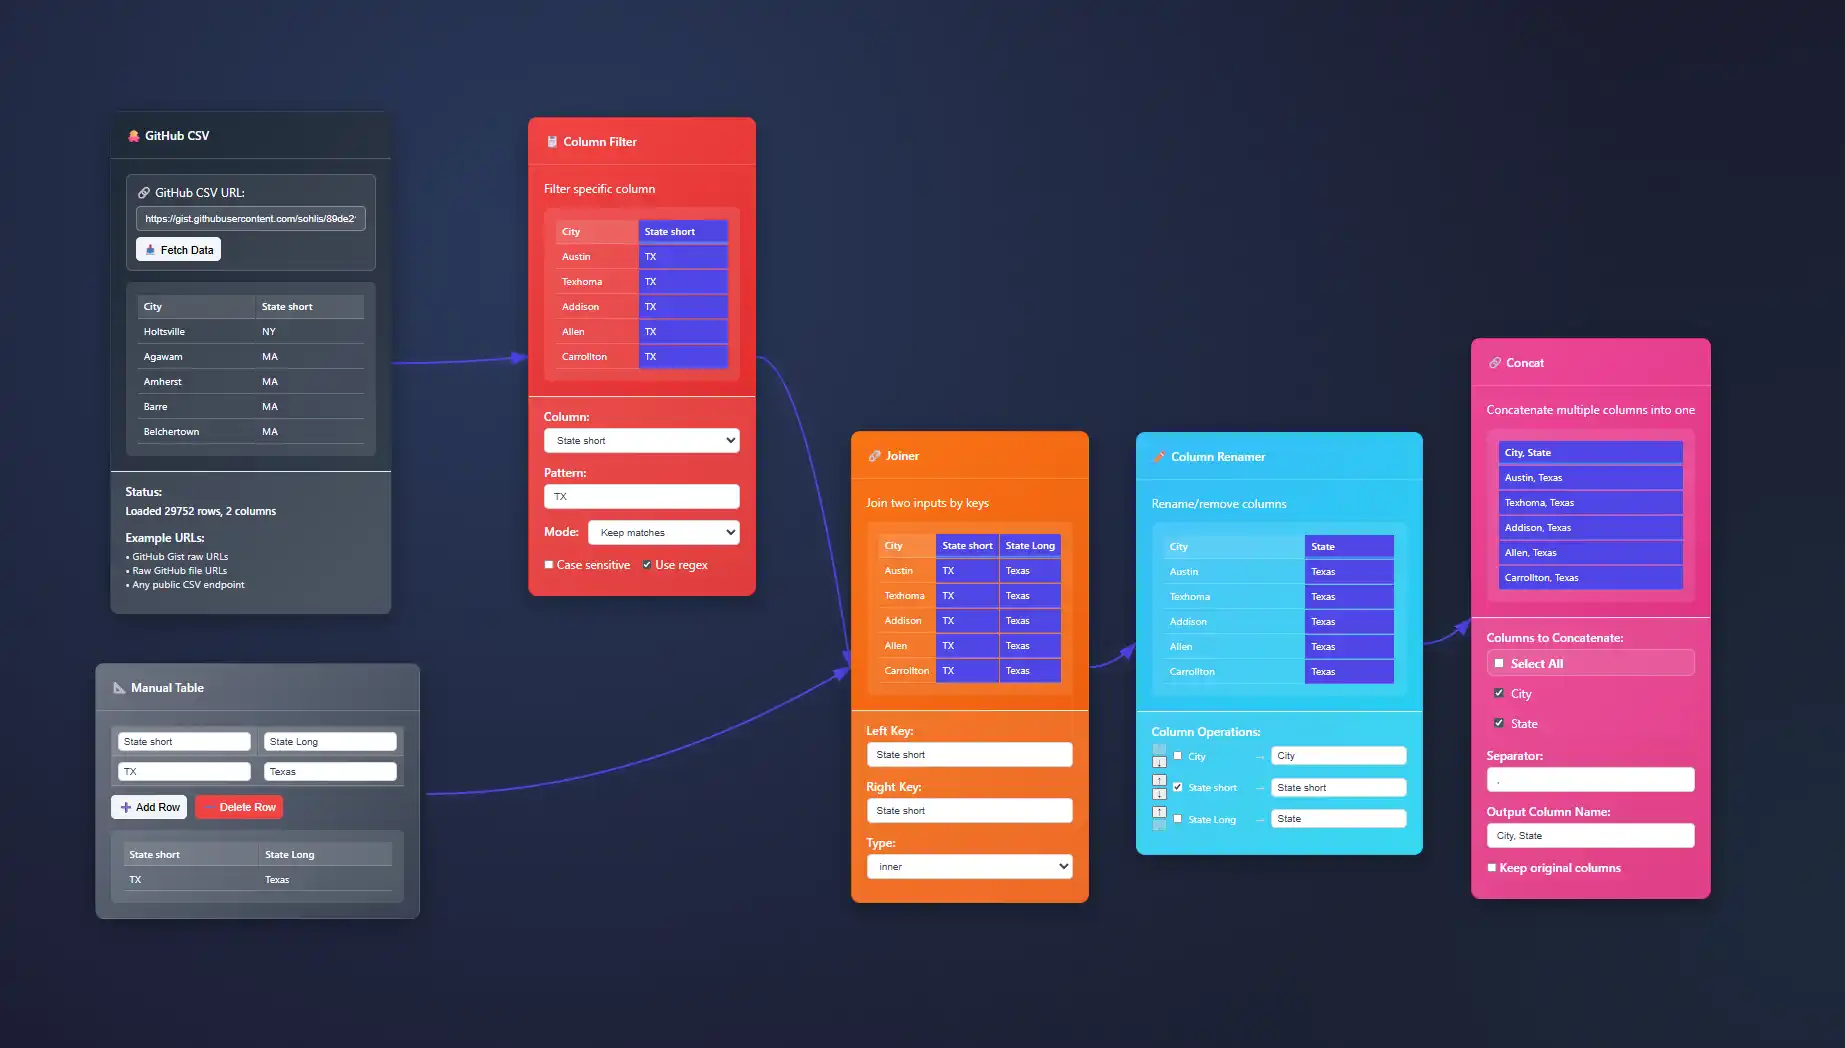
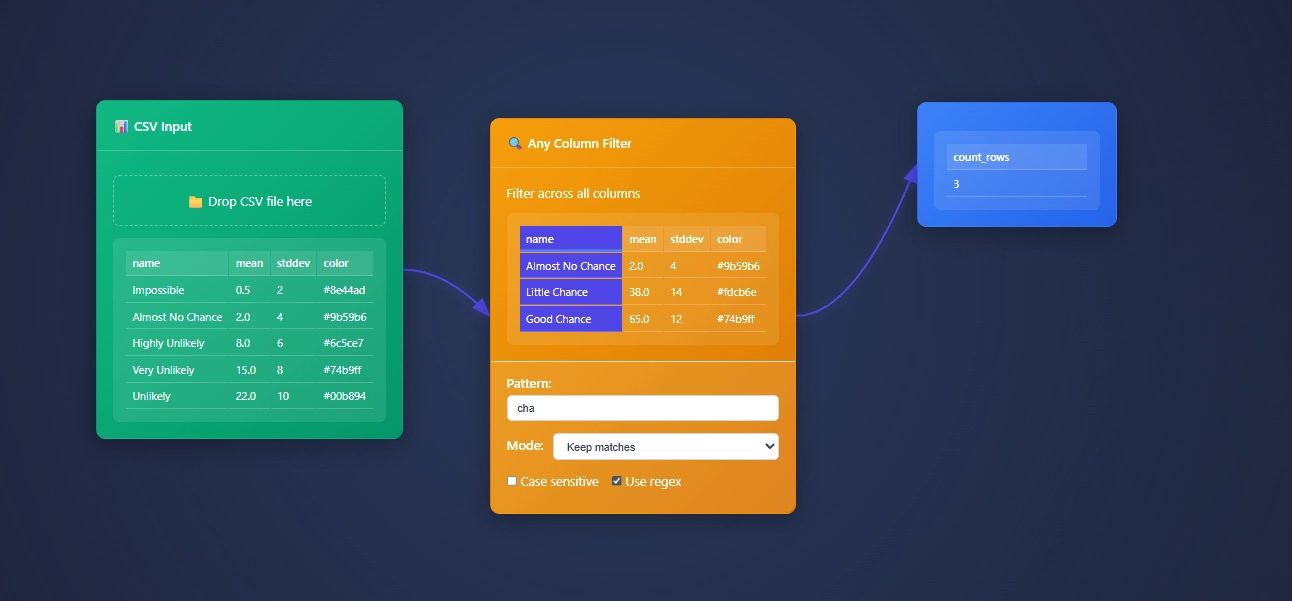
ET1 is a visual data workbench that lets you explore, clean, and explain data solutions.


- Access ET1
- Unlock 24 nodes
- Free ETL software
- Desktop friendly
- Code on GitHub iCore utilities, UI pieces, and node definitions live in the public repository so you can review how processing works.
- No storage
- ET1.1 + GitHub OAuth
- Unlock 29 nodes
- Workflows + Neon LakeiNeon Lake is the persistent store for workflow data and results. The free tier has no storage. This tier includes limited storage and 1 branch.
- 100/CU-monthiCU = Compute Unit. An internal measure we use to track processing cost across transforms.
- 500 MB storageiStorage in Neon Lake for tables and results. Retention policies may apply while we tune usage.
- 1 BranchiThis tier includes a single branch only.
- ET1.1 + GitHub OAuth
- Unlock 29 nodes
- Workflows + Neon Lake
- $0.28/CU-houriMetered compute beyond included quota. Priced per compute-hour equivalent derived from CU usage.
- $0.46/GB-monthiNeon Lake storage billed by logical GB-month. We may introduce archival tiers.
- 3 BranchesiEach branch has isolated CPU and storage. You only pay for the delta (the difference) between branches.
- SOC 2 • HIPAA • GDPR
- Regional locations
- User-level pricing
- $0.52/CU-hour
- $0.49/GB-month
- 10 Branches
- Unlimited databases & tables
Training Documentation
Use the training material to help you understand more about ET1 and how it helps solve data wrangling problems.

ET1 Basic Training
If you need help getting started, begin here.

ET1 Video Training
Learn the basics, the features, and more.
Future Insight
We see the future being focused on adoption, training, and creating Easy Tools for anyone. We are building an emerging technology while also maintaining a creative user experience that is inviting and friendly for all ages.
Inspiration
We are inspired by software, video games, and Sci-Fi movies like The Matrix, Minority Report and Ironman.
Join beta.
Why do you want to access beta?
News Analytics Visualization: Media Sentiment Tracking Platforms
In today's fast-paced, hyper-connected media environment, the volume of news and sentiment information can be overwhelming—yet harnessing insights within this data is more critical than ever. Decision-makers looking to remain agile and informed require innovative...
Construction Project Analytics: Timeline and Budget Visualization
In the ever-evolving landscape of the construction industry, project managers and executives face mounting pressures to optimize project timelines and budget utilization. The challenges are compounded by increased project complexities, vast data sources, and tight...
Food Safety Analytics: Supply Chain Contamination Tracking
When it comes to the global food supply chain, ensuring the safety, quality, and traceability of what we consume has never been more critical. With food-related recalls costing millions and negatively impacting brand reputation, businesses cannot afford complacency....
Streaming Media Analytics: Content Consumption Visualization Patterns
In the streaming media industry, understanding viewer behavior through data-driven analytics isn't just advantageous; it's essential to sustain competitive advantage. Faced with unprecedented growth and fiercely competitive markets, companies must leverage advanced...
Archaeological Data Visualization: Historical Site Analysis Tools
The intersection of archaeology and cutting-edge data visualization is revolutionizing how historical sites are explored, analyzed, and preserved. In an era where technological innovation propels insights, intuitive archaeological data visualization tools empower...
Library Science Analytics: Information Usage Pattern Visualization
In today's digital-driven landscape, libraries and information centers are more than just repositories of knowledge—they're powerful hubs of analytical insight. With extensive data accumulated through digital catalogs, borrow history, user research behaviors, and...
Disaster Response Visualization: Emergency Management Dashboards
The moment disaster strikes, decision-making velocity can mean the difference between recovery and catastrophe. Emergency responders rely heavily on actionable insights driven by clear, real-time visualizations tailored to crisis contexts. Enter emergency management...
Museum Visitor Analytics: Cultural Institution Data Visualization
Unlocking the power hidden within museum visitor analytics isn't just a technical possibility—it's a cultural imperative. Modern museums aren't just caretakers of human heritage; they are active hubs adapting to digital transformation. As visitor data analytics...
Waste Management Analytics: Environmental Impact Visualization
As global waste production accelerates rapidly alongside population growth and increased consumption, industry leaders are recognizing the critical importance of strategic waste management analytics. Data-driven analytics doesn't just streamline collection routes or...
Features of Today()+1
Available Now()


