Uncomplicate Data
Create end-to-end data analytics solutions in one app that is simple to use, and self-explanatory.
About ET1
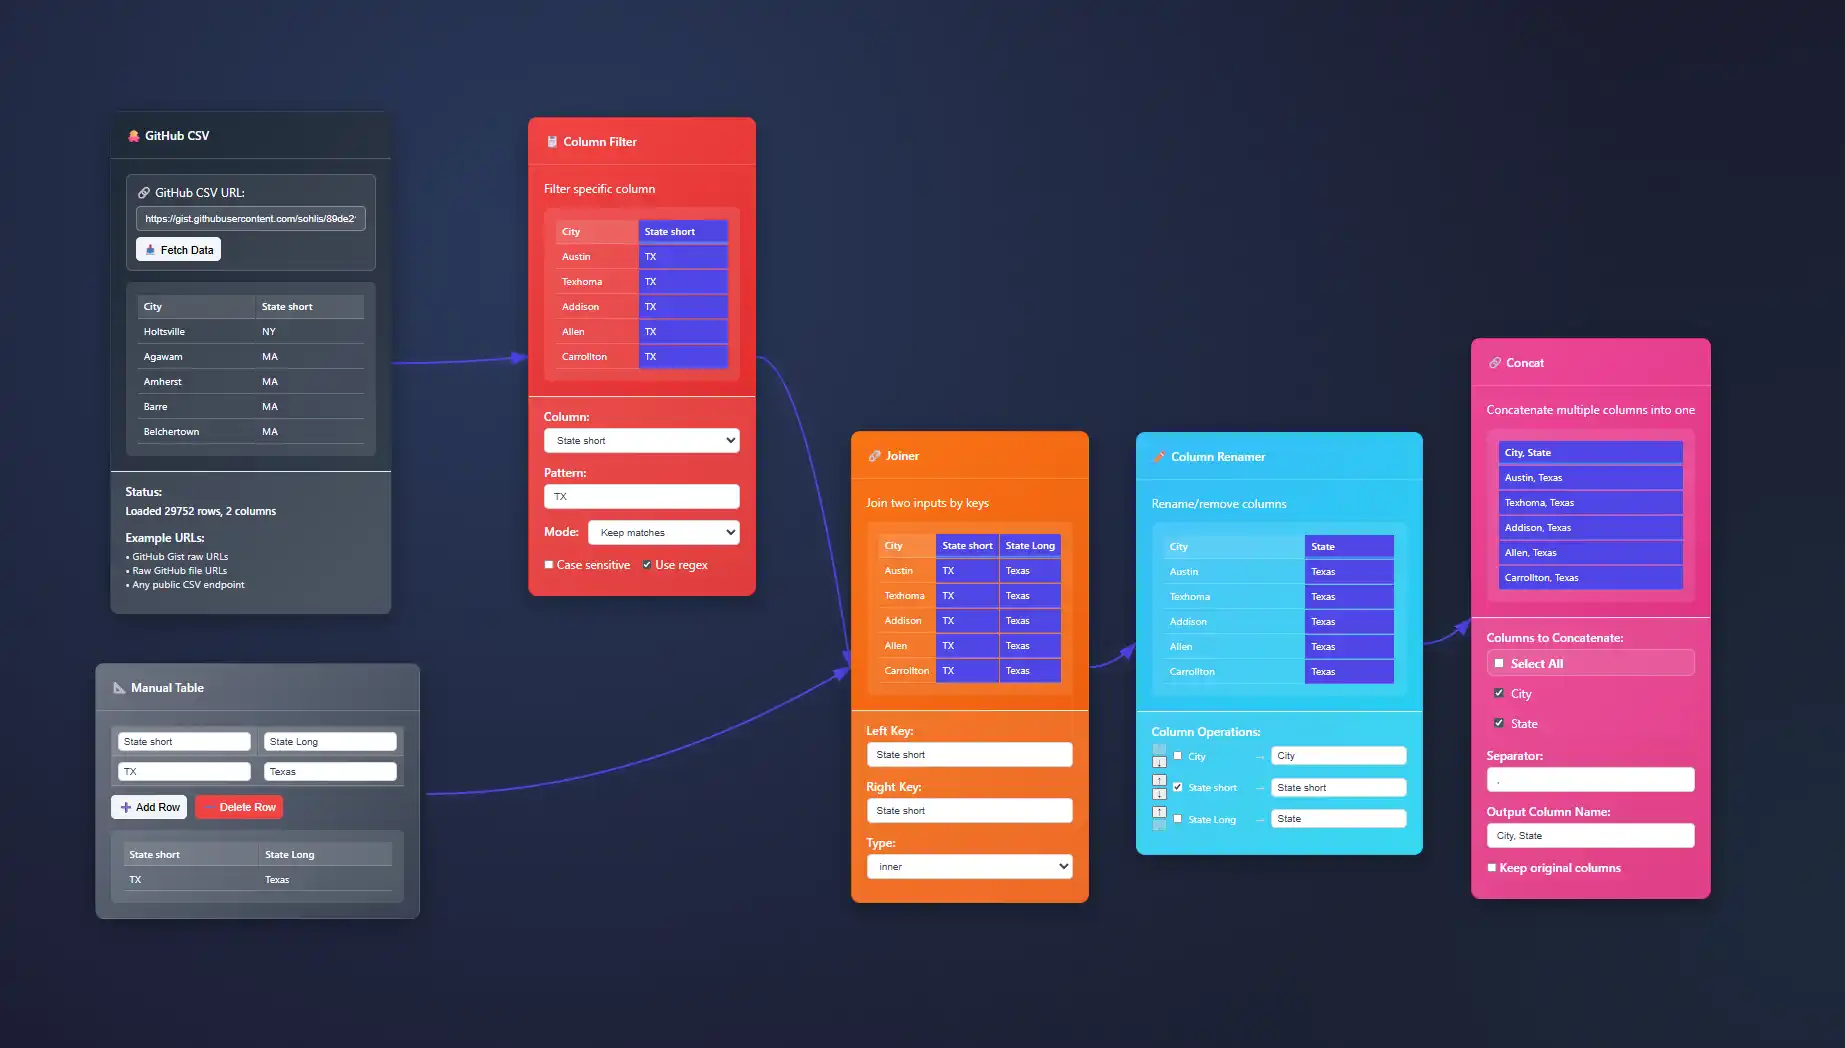
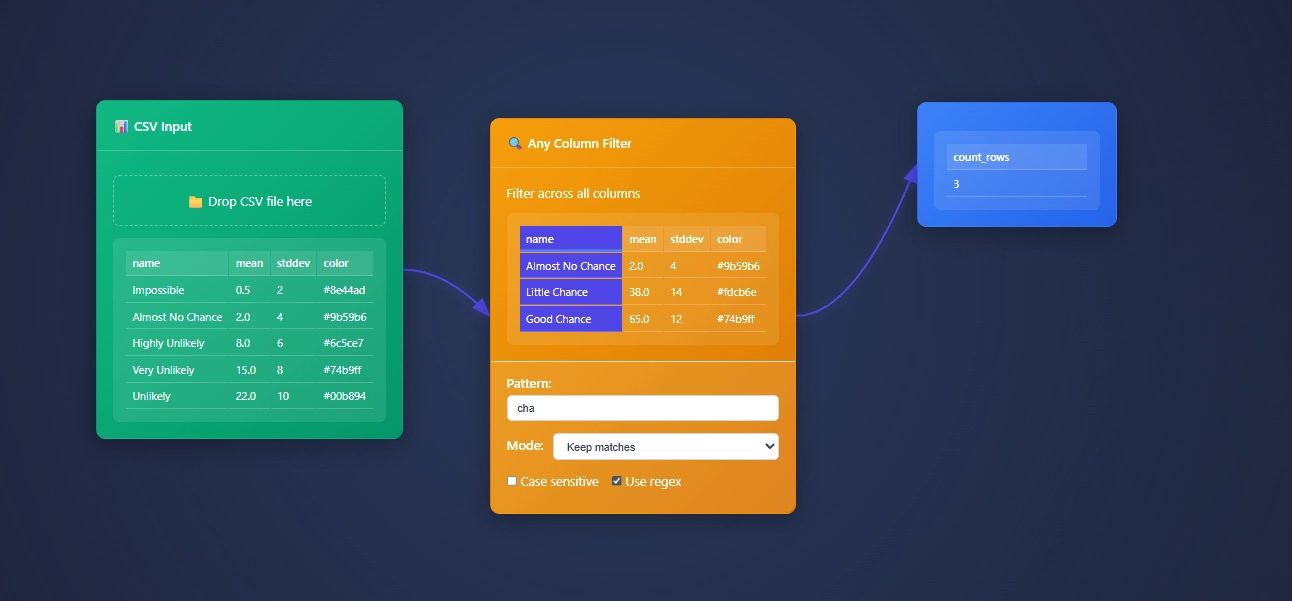
ET1 is a visual data workbench that lets you explore, clean, and explain data solutions.


- Access ET1
- Unlock 24 nodes
- Free ETL software
- Desktop friendly
- Code on GitHub iCore utilities, UI pieces, and node definitions live in the public repository so you can review how processing works.
- No storage
- ET1.1 + GitHub OAuth
- Unlock 29 nodes
- Workflows + Neon LakeiNeon Lake is the persistent store for workflow data and results. The free tier has no storage. This tier includes limited storage and 1 branch.
- 100/CU-monthiCU = Compute Unit. An internal measure we use to track processing cost across transforms.
- 500 MB storageiStorage in Neon Lake for tables and results. Retention policies may apply while we tune usage.
- 1 BranchiThis tier includes a single branch only.
- ET1.1 + GitHub OAuth
- Unlock 29 nodes
- Workflows + Neon Lake
- $0.28/CU-houriMetered compute beyond included quota. Priced per compute-hour equivalent derived from CU usage.
- $0.46/GB-monthiNeon Lake storage billed by logical GB-month. We may introduce archival tiers.
- 3 BranchesiEach branch has isolated CPU and storage. You only pay for the delta (the difference) between branches.
- SOC 2 • HIPAA • GDPR
- Regional locations
- User-level pricing
- $0.52/CU-hour
- $0.49/GB-month
- 10 Branches
- Unlimited databases & tables
Training Documentation
Use the training material to help you understand more about ET1 and how it helps solve data wrangling problems.

ET1 Basic Training
If you need help getting started, begin here.

ET1 Video Training
Learn the basics, the features, and more.
Future Insight
We see the future being focused on adoption, training, and creating Easy Tools for anyone. We are building an emerging technology while also maintaining a creative user experience that is inviting and friendly for all ages.
Inspiration
We are inspired by software, video games, and Sci-Fi movies like The Matrix, Minority Report and Ironman.
Join beta.
Why do you want to access beta?
Sports Analytics Visualization: Performance Metrics for Team Strategy
Sports analytics visualization has catapulted teams into a new era of data-driven decision-making, transforming raw statistics into actionable insights. Visualizing performance metrics is no longer optional but a competitive advantage embraced by elite sports...
Urban Planning Analytics: Smart City Data Visualization Solutions
Imagine a city that speaks—not through words but through data. Streets that communicate their congestion, buildings that inform about energy usage, infrastructure alerting officials before breakdowns occur—this vision is increasingly becoming the reality through the...
Commodity Trading Visualization: Market Volatility Analysis Tools
In an era where split-second decisions determine financial outcomes, commodity traders and financial analysts increasingly rely on sophisticated visualization tools to identify, interpret, and manage market volatility. The sheer volume, velocity, and variety of data...
Pharmaceutical Research Analytics: Drug Discovery Data Visualization
In the rapidly evolving world of pharmaceutical research, data isn't just abundant; it's exploding into unprecedented dimensions of complexity and potential. Navigating this landscape without strategic analytical tools and techniques is akin to attempting surgery in...
Insurance Risk Modeling: Actuarial Data Visualization Platforms
Insurance companies operate within complex ecosystems shaped by countless factors—from shifting market dynamics to unexpected global events. Predicting and visualizing insurance risks accurately has therefore become integral to maintaining competitive advantage and...
Telecommunications Network Analysis: Traffic Pattern Visualization
In the rapidly evolving landscape of telecommunications, understanding the flow of data has become critical to maintaining competitive advantage. Your networks generate vast and complex volumes of data every moment, with hidden patterns holding the keys to superior...
Legal Analytics Visualization: Case Outcome Prediction Dashboards
Imagine stepping into the courtroom, powered by predictive insights that elevate every decision you make. In today's high-stakes legal environment, data-driven strategies aren't just competitive advantages; they're necessities. Legal analytics visualization through...
Real Estate Market Analytics: Property Valuation Visualization Tools
The pulse of the real estate market beats steadily through data-driven analytics. For real estate professionals, investors, and decision-makers, staying ahead demands more than intuition—it requires sophisticated property valuation visualization tools that transform...
Gaming Analytics Dashboards: Player Behavior Visualization Systems
In the fiercely competitive gaming industry, understanding player behavior is no longer a luxury—it's an outright necessity. With millions of data points created every second by players around the globe, turning this ocean of information into actionable insights is a...
Features of Today()+1
Available Now()


