Uncomplicate Data
Create end-to-end data analytics solutions in one app that is simple to use, and self-explanatory.
About ET1
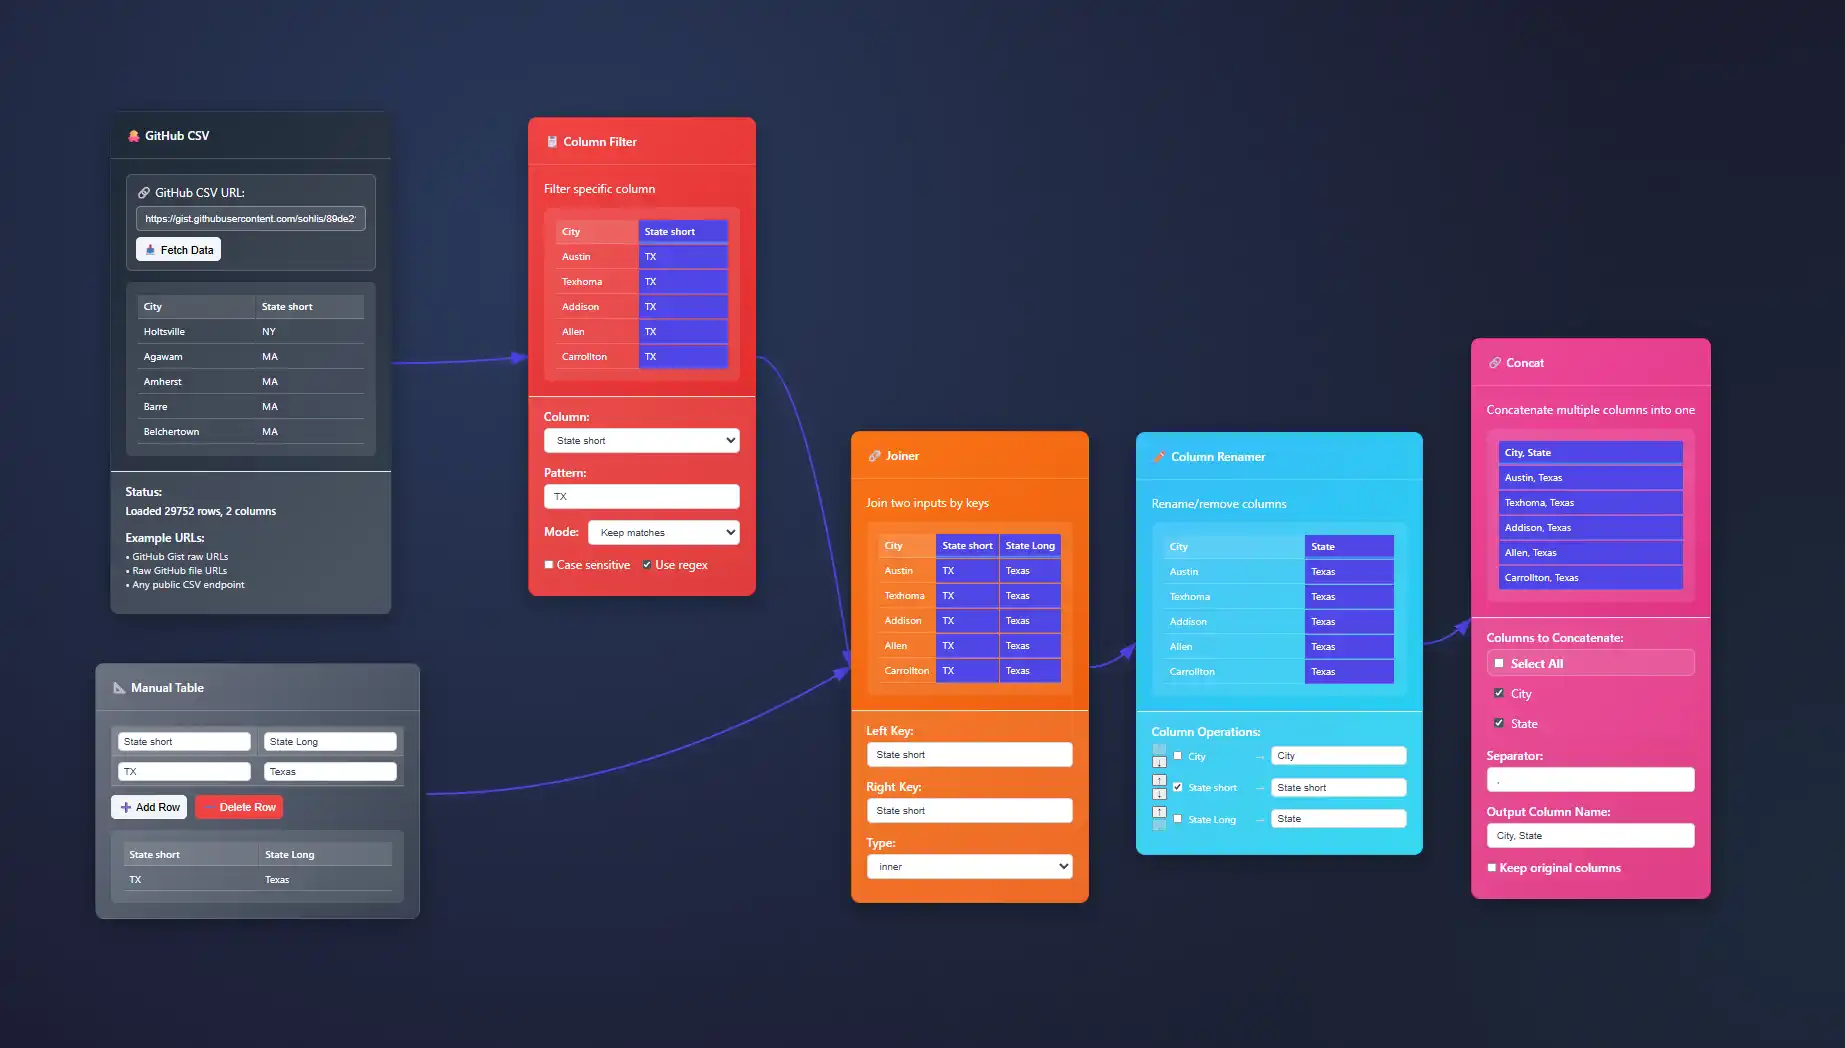
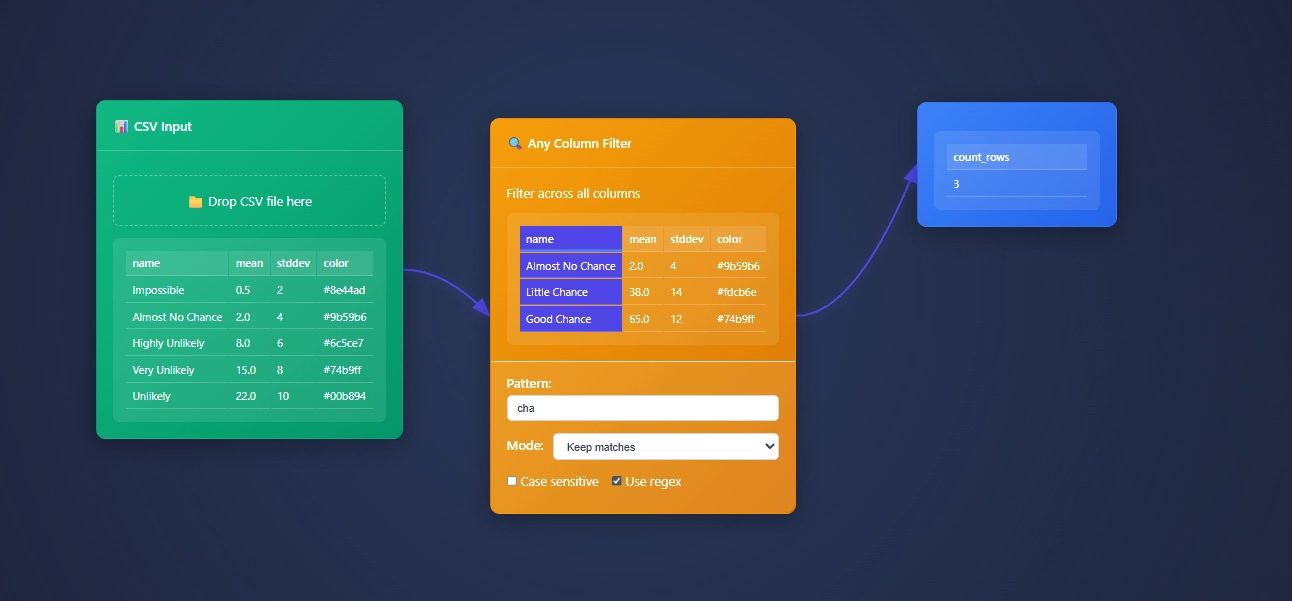
ET1 is a visual data workbench that lets you explore, clean, and explain data solutions.


- Access ET1
- Unlock 24 nodes
- Free ETL software
- Desktop friendly
- Code on GitHub iCore utilities, UI pieces, and node definitions live in the public repository so you can review how processing works.
- No storage
- ET1.1 + GitHub OAuth
- Unlock 29 nodes
- Workflows + Neon LakeiNeon Lake is the persistent store for workflow data and results. The free tier has no storage. This tier includes limited storage and 1 branch.
- 100/CU-monthiCU = Compute Unit. An internal measure we use to track processing cost across transforms.
- 500 MB storageiStorage in Neon Lake for tables and results. Retention policies may apply while we tune usage.
- 1 BranchiThis tier includes a single branch only.
- ET1.1 + GitHub OAuth
- Unlock 29 nodes
- Workflows + Neon Lake
- $0.28/CU-houriMetered compute beyond included quota. Priced per compute-hour equivalent derived from CU usage.
- $0.46/GB-monthiNeon Lake storage billed by logical GB-month. We may introduce archival tiers.
- 3 BranchesiEach branch has isolated CPU and storage. You only pay for the delta (the difference) between branches.
- SOC 2 • HIPAA • GDPR
- Regional locations
- User-level pricing
- $0.52/CU-hour
- $0.49/GB-month
- 10 Branches
- Unlimited databases & tables
Training Documentation
Use the training material to help you understand more about ET1 and how it helps solve data wrangling problems.

ET1 Basic Training
If you need help getting started, begin here.

ET1 Video Training
Learn the basics, the features, and more.
Future Insight
We see the future being focused on adoption, training, and creating Easy Tools for anyone. We are building an emerging technology while also maintaining a creative user experience that is inviting and friendly for all ages.
Inspiration
We are inspired by software, video games, and Sci-Fi movies like The Matrix, Minority Report and Ironman.
Join beta.
Why do you want to access beta?
API Performance Visualization: Microservices Monitoring Strategies
In today's dynamic digital landscape, businesses depend heavily on microservices to achieve scalability, agility, and rapid innovation. As organizations scale their applications, Application Programming Interfaces (APIs) emerge as essential connectors enabling...
Patent Landscape Visualization: Intellectual Property Analysis Tools
In the rapidly evolving world of innovation, patents represent a strategic leverage point that can make or break an organization's competitive advantage. Patents hold immense value, but they can also be overwhelming to analyze. How do technology leaders efficiently...
Manufacturing Quality Control: Statistical Process Control Dashboards
Imagine having unhindered visibility into your production line—knowing precisely what causes defects, forecasting issues proactively, and gaining control that turns insights into immediate improvements. In today's hyper-competitive manufacturing environment,...
Social Network Analysis: Community Detection Visualization Methods
Imagine navigating through a complex web of relationships, effortlessly seeing hidden patterns emerge. Social Network Analysis (SNA) and its powerful visualization techniques allow decision-makers to decode these interconnected relationships quickly and effectively....
Agricultural Analytics: Precision Farming Data Visualization
Agriculture is undergoing a radical transformation driven by data analytics and innovative technology. As farms become increasingly digitized, the collection and visualization of agricultural data are transforming traditional practices into precision farming. By...
Transportation Logistics: Route Optimization Visualization Platforms
Imagine wielding the power to see every stop, shipment, and delay within your transportation logistics network—not simply as numbers buried in spreadsheets but as dynamic visual representations that clarify, optimize, and enhance your strategic decisions. Today's...
Medical Imaging Analytics: Diagnostic Data Visualization Tools
In modern medicine, the right diagnostic visualization tools can make the difference between early detection and missed opportunities. Medical imaging analytics harness cutting-edge visualization technology and powerful algorithms to present complex diagnostic data in...
Retail Space Analytics: Store Layout Optimization Through Data
Imagine stepping into a store and effortlessly finding everything exactly where you expect it to be—the aisles feel intuitive, products entice from the shelves, and the environment gently guides you toward purchases. This seamless customer journey isn't just luck;...
Educational Data Mining: Student Performance Visualization Systems
In today's complex educational landscape, understanding and optimizing student performance is critical for institutional success. Educational data mining, combined with cutting-edge data visualization techniques, offers school administrators and educational leaders a...
Features of Today()+1
Available Now()


