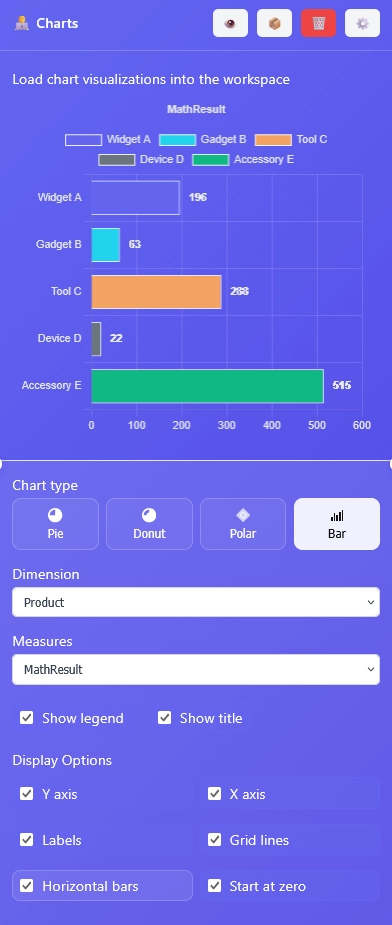
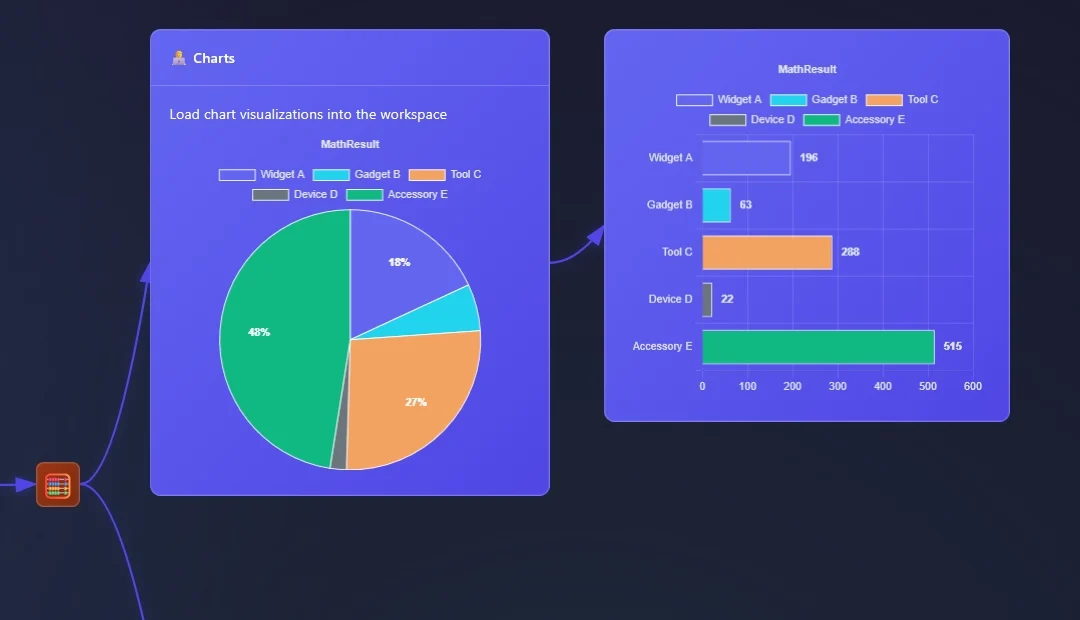
In ET1.1 Neon you can now pipeline your data to Charts.
- Pie Chart
- Donut Chart
- Polar Chart
- Bar Chart
This covers an array of classic data visualizations and the same highlighting functionally flows through from data grid to charts. Making it the first ETL software that can show you up and downstream what is happening by mousing over and highlighting in the software.
These data visualizations are “single measure” and “single dimensions” charts.
How to use Charts
We made Charts user friendly!
- Access et1.1
- Open data in CSV Node, JSON Node, Neon Input or others
- Pipeline data to Charts Node
Charts Node will automatically infer a good dimension and measure based on what you’re sending to the node. Also, manual selections are good for directing the tool the right direction.
Data can continue to pass through the charts.
Charts Node: Bar Chart
Creating a bar chart in ET1.1 is possible and has the most settings currently. However in the spirit keeping everything very simple and user friendly for the future of AR/VR users, we want to reduce whatever settings possible and each Chart Type selection will hide “features” related to that chart type, which we are going to term “display options” for the foreseeable future.

Here’s the bar chart features aka Display Options:
- Y axis
- X axis
- Labels
- Grid Lines
- Horizontal Bars
- Start at zero
Display options are change as Chart Types change.
Pie Charts and Donut Charts in ET1 Charts Node
Pie charts and donut chart are similar.


Polar Chart in ET1 Charts Node
Seeking a no-code way to create chartjs Polar charts? Look no further, we built that app here!
Polar Chart is a unique chart not commonly found in data visualization consulting services engagements and fit perfectly into our ET1 framework.

Thanks for checking out The Charts Node by DEV3LOPCOM, LLC
We appreciate your interest in ET1 and hope it changes the way you think about solving problems.
Now, with end-to-end analytics, we can start focusing on the next realm!
Please contact DEV3LOPCOM, LLC for more information.
Dev3lop was founded in 2016 by Tyler Garrett!
Also, learn about how we are the first ETL/Visualization company to deploy Google Ai Edge technology in ET1.1, so that you can use your fingers/hand to solve problems, which turns this into a multiplayer solution!
Return to ET1 Overview to learn more.


