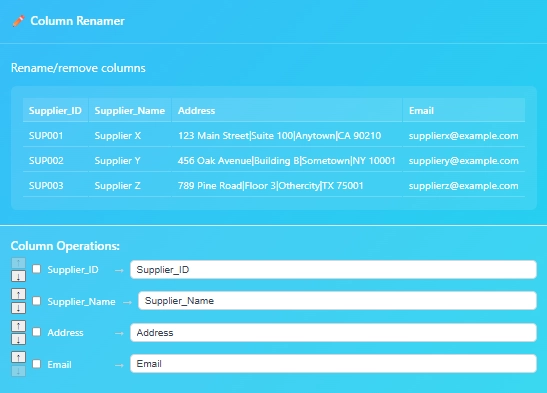
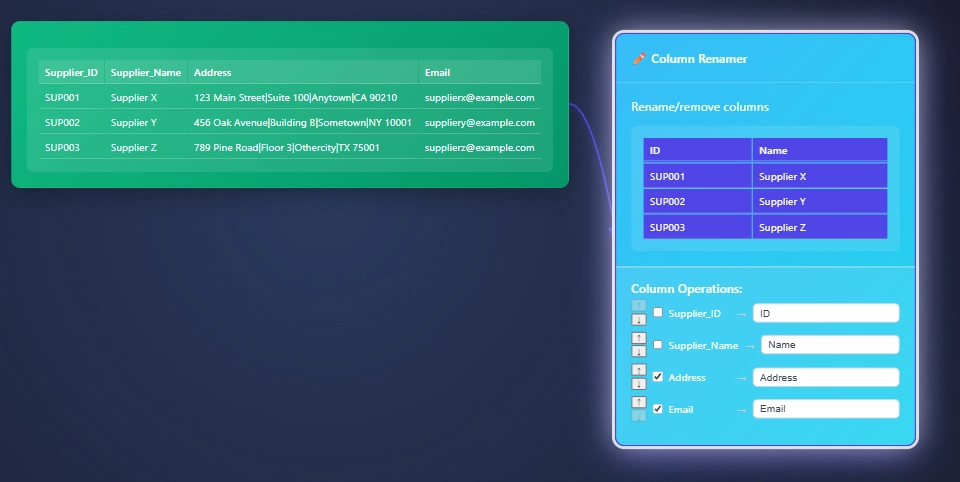
Renaming columns in ET1 is straightforward and intuitive. You can also move the position of your columns by bumping the column left or right. Last, but not least, the ability to remove the column from the table.
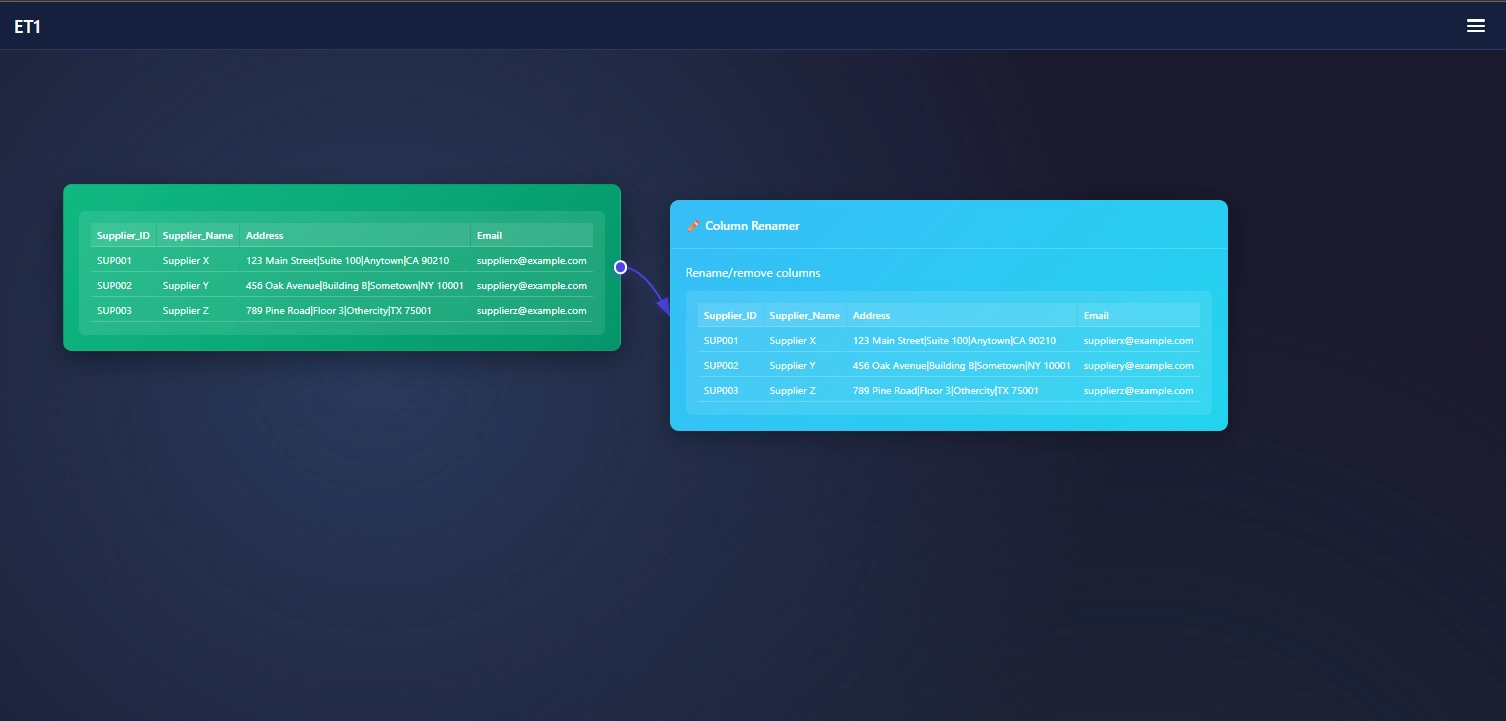
Column Renamer in ET1 is the place to manage your columns header name, the position of the column, and removing columns from your data stream.
Using Column Renamer
Connect data downstream to the Column Renamer
Manage your table in the Column Renamer
Open the settings by hovering over the node and clicking the settings button.
The checkbox: Removes columns
The arrows bumps the column left or right
Rename the column
In our use case, we want to remove address and email as it’s not relevant for our end goal. We simply check the box to remove the column. Next, we rename the column Supplier_ID to ID, and Supplier_Name to just Name. Done!
Thanks for learning more about ET1 and know if you have any questions… Please contact us.
You’ve probably heard it said that Excel is the “Swiss Army Knife” of business tools. It can crunch numbers, track budgets, and even spin up in-house dashboards. But when your organization relies on spreadsheet pivot tables to make key decisions, there’s a strong chance you’re trapped in a Waterfall approach—rigid, siloed, and lacking the valuable feedback loops that truly enable innovation. At dev3lop, a software consulting LLC renowned for our focus on data, analytics, and innovation, we often encounter clients who admit, “We built this in Excel because it was quick and easy.” Unfortunately, “quick and easy” often translates into siloed data practices that limit collaboration, stifle real-time insights, and perpetuate a slow decision-making cycle. This is especially evident when crucial information is funneling through a single spreadsheet maintained by a designated “Excel wizard” who shoulders the entire analysis burden.
Our mission is to help organizations break free from this archaic setup. We’ve witnessed how Excel-based processes can put the brakes on projects, forcing teams to wait for sign-offs and updates, then unraveling progress when a single rogue macro breaks or a formula gets corrupted. In a truly modern context, the marketplace changes faster than that stagnating spreadsheet. The Waterfall style might feel structured—each phase is planned and meticulously outlined—but that same rigidity can’t adapt when variables shift. If your analytics strategy can’t pivot on a dime, you’re missing out on real-time data advantages. We believe that a modern approach to project management calls for agile methodologies, robust data pipelines, and powerful analytical platforms that offer transparency, scalability, and the resilience to flex as your business does.
What Excel Tells You About Your Process
Excel usage in the enterprise is more than just a technology choice: it’s a red flag about the overarching process. In Waterfall, requirements are locked in at the outset, progress is linear, and changes can be both costly and time-consuming. Likewise, the typical “Excel solution” is a quick patch reliant on preset formulas and static data extracts. Instead of fostering a continuous cycle of improvement, this approach often cements a process as “good enough,” thereby delaying necessary modernization. When your business intelligence and weekly reports hinge on emailing or uploading spreadsheets, leaders spend valuable time resolving version-control issues and reconciling mismatched data rather than generating insights that steer strategic initiatives.
At dev3lop, we’ve helped clients recognize that overreliance on spreadsheets can hamper more advanced capabilities like real-time dashboards, predictive modeling, or even seamless database integration. We believe in leveraging robust platforms and frameworks to create solutions that stand the test of time. For instance, our data engineering consulting services in Austin, Texas can seamlessly integrate your data streams into cloud architectures, ensuring that your teams can easily access and analyze information without the friction of manual consolidation. From enhancing user experience with a clear and concise privacy policy to streamlining production planning, modernizing data processes is a catalyst for agility. You also open the door to more advanced analytics, including the benefits of interactive data visualization that pivot away from static rows and columns and toward real-time user exploration.
These are not superficial modifications—they’re the backbone of eliminating version confusion and bridging the gap between siloed departments. By stepping away from a single spreadsheet, you can tap into enterprise-level data pipelines. This fosters alignment across accounting, marketing, and supply chain, drawing teams into the same conversation rather than relying on short-term fixes. As data moves from local spreadsheets into robust analytics landscapes, your organizational approach evolves with it—and that is exactly how you break free from a Waterfall mindset.
Overcoming the Waterfall Mindset
Earlier in a project’s life cycle, Waterfall-style planning can seem comforting. You feel in control—requirements are set, tasks are neatly assigned, and spreadsheets are distributed as needed. Yet, any shift in business priorities can quickly unravel the entire design. If your marketing campaign unexpectedly outperforms, or you discover a new compliance requirement halfway through implementation, that neat plan no longer holds. The cost of rework—and the friction of moving your analysis out of Excel—can prove enormous. Enter Agile: an iterative approach that welcomes new information, adapts to market feedback, and iterates continuously on products or services.
Transitioning from spreadsheets to robust data pipelines is a vital first step in this direction. We encourage clients to adopt agile analytics cycles that empower them to learn and pivot continuously. This also extends to best practices in data querying—like understanding the difference between Union and Union All in SQL—ensuring that your analytics environment accommodates growth without slowing it down. When you build your data strategy on scalable solutions, your organization gains the capacity to make real-time decisions grounded in validated data sources.
Moreover, you can accelerate experimentation by building proof of concepts with clients in real-time. This is a far cry from the Waterfall approach, where months can pass before end-users see tangible outputs. Agile sprints allow teams to test-drive new ideas and gather feedback immediately. Risk mitigation becomes proactive rather than reactive, as you’re identifying issues early. All of these shifts foster a mindset that values flexible problem-solving and continuous improvement, pushing your organization beyond the stagnant Waterfall model.
Embracing Agile Data and Analytics
Attaining agility entails more than just ditching Excel. It demands a nuanced transformation of your data infrastructure, mindset, and organizational culture. Instead of spending weeks perfecting pivot tables, your teams can focus on building scalable, integrated solutions that evolve as the business does. Our experience at dev3lop has shown that deploying enterprise-level analytics tools and linking them to dynamic dashboards can vastly cut down on decision latency.
Once you leave behind the spreadsheets, or at least diminish their role to one-off analyses, you free up bandwidth to focus on building sophisticated data capabilities. This includes designing advanced models that forecast demand or identify customer churn before it happens, thereby proactively driving your business forward. By adopting a continuous delivery model, you bring speed and flexibility to the analytics process, ensuring teams aren’t left waiting for end-of-cycle revelations. It’s about fostering a culture of adaptation—one that values real-time data flows over rigid sign-off processes. When new data sources appear, or industry regulations change, your systems and workflows can adapt with minimal disruption.
Ultimately, your transition away from Waterfall and toward agile data practices will not only optimize internal workflows but also enrich the experiences of your customers and partners. With integrated data sources, you can address challenges at the root rather than applying short-lived patches in Excel. You’ll identify actionable insights faster, build trust through transparency, and position your organization at the forefront of innovation. So if you still find yourself relying on a spreadsheet to handle mission-critical tasks, consider it a wake-up call: it’s time to pivot, adapt, and unleash the full potential of your data.
In an age dominated by digital transformation, quick API consulting engagements are becoming more crucial than ever. Every organization, from emerging startups to established enterprises, is seeking efficient ways to integrate systems, leverage real-time data, and deliver immediate business outcomes. At our software consulting LLC, we prioritize speed, quality, and innovation—core pillars that drive genuine impact. When done right, an API engagement can transform the flow of information between teams, improve decision-making capabilities, and enhance customer experiences. Yet achieving this in a short timeframe requires more than technical know-how; it calls for strategic planning, data-driven insights, and a deep understanding of how technology can align with overall business goals.
Data and analytics form the backbone of these high-impact consulting projects. Whether you’re modernizing legacy systems or unifying disparate data sources, embracing robust data practices is key to success. By focusing on domain-driven design principles and architectural scalability, organizations can build APIs that are both nimble and future-proof. This aligns perfectly with a broader strategy of leveraging business intelligence, advanced analytics, and process automation to bolster operational efficiency. In many cases, a carefully planned API engagement can address immediate technical needs while also laying the groundwork for long-term digital transformation. From rapid proof-of-concepts to full-scale production deployments, it’s about creating momentum that stakeholders can see, measure, and continue to build upon.
Understanding the Core Drivers of Success
At the heart of any successful quick API consulting engagement are the core drivers that orchestrate technology solutions into tangible business value. Clear communication of objectives is one such driver, ensuring that the consulting team and client stakeholders share a common vision. By establishing a roadmap with specific milestones and key performance indicators (KPIs), organizations can track the trajectory of API initiatives. Equally critical is the alignment of technical choices with the organization’s broader strategy—particularly when it comes to data modeling, system architecture, and user experience.
For companies grappling with large volumes of data or those aiming to modernize older systems, aligning API strategies with robust data analytics frameworks can unlock unexpected advantages. For instance, our team often integrates MySQL databases to rapidly prototype new features. If you need advanced guidance, you can explore our MySQL consulting services and discover how a ready-to-scale data layer can accelerate your entire digital ecosystem. The result isn’t merely faster deployment times or smoother system integrations; it’s also a heightened ability to adapt and pivot as market demands evolve. By focusing on these core drivers—communication, alignment, and scalability—decision-makers can ensure that every component of their API initiative drives value, rather than just sends data back and forth.
Building Effective Data and Analytics Foundations
In the world of quick API consulting, a strong data foundation is the bedrock upon which agile API development thrives. This includes setting up robust infrastructure for data collection, storage, and processing. In many engagements, companies overlook the vital step of mapping how data flows across APIs, leading to missed insights and suboptimal analytics. The beauty of a quick API model is that it can serve as a lightweight yet powerful engine for capturing valuable information—in real time. But to maximize that potential, strategic data governance must be in place.
When organizations have clarity on their data strategy, they can embark on more complex initiatives like predictive analytics or advanced dashboards. If you want to dive deeper into how data analytics can transform your business, visit our comprehensive guide on uncovering hidden opportunities unleashing growth potential through data analytics. Once data pipelines are established, these foundations can inform everything from marketing personalization to operational forecasting. The result? High-impact insights that flow directly to decision-makers, illuminating the path to better products, stronger customer relationships, and new streams of revenue. By integrating a well-structured data plan into even the shortest API initiatives, you ensure that each sprint and milestone yields immediate—and lasting—value.
Accelerating Innovation Through Agile API Strategies
Time-to-market pressures demand an agile approach that can effectively scale new offerings without sacrificing quality. Agile API strategies, characterized by iterative development and continuous feedback loops, reduce risk while fostering innovation. In these engagements, short development cycles empower technical teams to incorporate user feedback quickly, thus honing the APIs to meet changing business requirements. Moreover, agile strategies facilitate experimentation—an integral element of thriving in dynamic market landscapes. Combining agility with data-driven insights opens the door to creative possibilities.
For instance, visualizing data in innovative formats can reveal new use cases for an API beyond its initial scope, fueling further growth. If you’re seeking inspiration and practical techniques, consider our resource on creative ways to visualize your data. By continually refining how you present information internally and externally, you can transform a routine API integration into a competitive advantage. From bridging legacy systems to expanding capabilities in the Internet of Things (IoT) domain, agile API approaches give businesses the flexibility to pivot quickly without losing momentum. The key is fostering a culture where experimentation is encouraged, lessons are documented, and wins are rapidly scaled—resulting in a faster, smarter route to tangible results.
Bringing It All Together
Driving value in quick API consulting engagements ultimately boils down to cohesive coordination across teams, technologies, and data repositories. By establishing solid governance mechanisms—such as version control, comprehensive documentation, and automated testing—organizations can rapidly deploy APIs without sacrificing reliability. Equally important is leveraging data to better understand consumer behavior or optimize operational workflows. Our explorations in analyzing data on the use of transportation services demonstrate how even the most routine operational data can unveil powerful insights when integrated with the right API solutions.
A key factor in ensuring long-term utility is selecting the optimal data extraction methodology. Modern solutions increasingly favor ELT over ETL techniques to streamline analytics workflows. To learn why, explore our thoughts on why ELT makes more sense than ETL in 2025. By combining robust data strategies, proven agile methods, and a clear focus on measurable business outcomes, quick API engagements can do more than just solve an immediate technical challenge—they can become catalysts for broader digital transformation. From shaping strategy to accelerating ROI, deploying an API in today’s dynamic environment opens the door to endless possibilities.
Imagine standing on the edge of a data goldmine, uncertain how to tap into its riches. You sense the vast potential, but your instincts alone aren’t enough to navigate the complexities of modern analytics. That’s precisely where our data-focused software consulting LLC steps in—to transform your hunches and intuition into a robust, predictive strategy. Many of our clients come to us having relied for years on gut feelings and firsthand market experience. While their expertise is invaluable, the shortcomings become obvious as they grow: too much guesswork, too little systematic insight. This blog post is an exploration of that moment—the tipping point where an organization transitions from human instinct to powered-by-insight decision-making and discovers that data is more than just an afterthought. It’s the key to fueling growth, innovation, and competitive differentiation.
Data is a living, breathing asset that can reveal hidden trends, predict consumer behavior, and streamline operations. But the journey from gut feelings to predictive models is as much about organizational change as it is about technology. We at our consulting firm focus on creating a smooth pivot that blends your internal expertise with advanced analytics capabilities. The result? Data-backed predictions, interactive dashboards, and evidence-based roadmaps that lead to more confident decision-making. In this article, we’ll walk through the critical phases of this transition, shedding light on the strategies we employ to harness data effectively. Whether you’re just beginning to collect data or seeking to optimize your artificial intelligence (AI) pipeline, our experience shows that every leap forward starts with the decision to leave guesswork behind.
Defining the Data-Driven Mindset
Too often, organizations believe that data analytics is advanced mathematics reserved for a specialized team behind closed doors. Yet, the shift to a data-driven mindset is a company-wide effort—everyone from marketing to operations to finance has a role to play. This mindset begins with recognizing data as a core strategic asset, equally important as brand equity or team morale. While instincts can guide initial business tactics, the turning point emerges when leadership asks, “What can hard evidence tell us that we don’t already know?” Our own journey with clients starts there, helping them realize that the raw insights within their spreadsheets, online platforms, and customer interactions can be transformed into operational advantages.
Cultivating this mindset requires more than a new job title or software tool. It involves a willingness to question assumptions through hypothesis testing, modeling, and experimentation. At our firm, we draw on comprehensive data services to support your organizational evolution. From data visualization and BI dashboards to AI-driven predictions and machine learning solutions, our offerings guide you through each stage of maturity. We also aim to instill best practices in data governance and ethics from day one, ensuring that insights are accurate, fair, and considerate of privacy. For those looking to explore data visualization in greater depth, consider our overview of data visualization consulting services to learn how real-time dashboards and analytics can transform raw data into compelling, actionable stories. Here, the chief difference is that your gut feeling is no longer the sole driver—quantifiable metrics, historical trends, and advanced forecasting form the backbone of sound strategic decisions. Organizations that embrace this new mindset consistently outperform those that cling to intuition alone. By weaving analytics into every department, you create a culture that sees data not as a static record, but as a dynamic resource for ongoing innovation.
The Roadmap for Implementation
Taking on a data-driven approach isn’t just about technology adoption; it’s about laying a foundation that supports continuous improvement. The first step generally begins with an audit of your existing data infrastructure. This involves identifying all sources—website traffic, social media interactions, customer service logs, point-of-sale systems, and more. If you’re collecting data from external platforms like Instagram, you might find it inefficient to do manual exports or rely on spreadsheets. That’s why we often guide clients toward solutions such as Send Instagram Data to Google Big Query Using Node.js, which automates the gathering of social intelligence in real time.
Once your sources are identified and the data is consolidated, our focus shifts to cleaning and preparing the information. A dataset riddled with duplicates, missing values, or outdated metrics can mislead decision-makers. Through automatic data pipelines and quality checks, we ensure that your analytics stack rests on a solid, trustworthy base. Next comes the modeling phase, where we deploy algorithms tailored to your business question—whether it’s customer segmentation, forecasting demand, or spotting supply chain inefficiencies. Along this journey, dashboards and visualization tools become instrumental in explaining insights to diverse departments, transforming complex data into easy-to-digest visuals. Finally, we align these insights with strategic objectives. If your company aims to expand into new markets, we can seamlessly weave insights from your web analytics, social sentiment, and operational data to predict the best course of action. Real-world success demands more than a single analytics project—it craves iterative updates. Every time an insight is revealed, a new question arises, fueling a virtuous cycle of discovery, analysis, and action. By charting this roadmap, we help clients pivot away from trusting only instincts and move toward systematic, evidence-based strategies.
Crafting Advanced Analytics
Transitioning from descriptive to predictive analytics demands a refined approach. While descriptive analytics explains what has already happened—like “sales dipped last quarter” or “website engagement soared”—predictive analytics attempts to forecast what will happen next. Adopting an advanced analytics framework means identifying the methods, techniques, and technologies most suited to your unique challenges. Perhaps your marketing team needs to forecast lead conversions, or your logistics division aims to optimize shipping routes. We tailor each model to specific objectives, using machine learning algorithms and statistical methods that yield accurate, actionable insights.
Implementing predictive models also involves an ongoing feedback cycle to maintain relevance amid shifting market dynamics. Data drift—a phenomenon where variables change over time—can erode model performance unless you’re conducting regular evaluations. Our consultancy dev3lop.com doesn’t just help with the initial setup; we also coach your team on best practices for continuous improvement. For instance, if your organization deals with user authentication or sign-in data, integrating a specialized pipeline—such as the approach in Send Auth0 Data to Google Bigquery Using Node.js—can connect real-time user data to your predictive models. In doing so, you gain a clear view of where the user journey might lead and how to best cater to those evolving needs. Predictive models are not a magic bullet; rather, they are instruments that can refine internal hypotheses and drive data-backed experimentation. By aligning advanced analytics with broader strategic goals, we enable decision-makers to move steadfastly beyond gut feelings, arming them with a deep, empirical understanding of emerging possibilities.
Ensuring Ethics and Sustainability
As organizations lean more heavily on data for decision-making, ethical considerations come into sharp focus. Data analytics opens the door to unprecedented insights—even into sensitive areas like consumer preferences, personal habits, or employee productivity. While this intelligence can offer significant competitive advantages, the stakes are high. Mishandling data leads to privacy breaches, brand distrust, and potentially regulatory fines. This is why we emphasize building transparent processes and robust governance frameworks right from the start. A data-driven mindset should never ignore the societal and human implications that come with analytics. If you’d like to know more about striking this balance, take a look at Ethical Considerations of Data Analytics, which delves deeper into issues of privacy, bias, and responsible data usage.
Beyond privacy, the sustainability and fairness of your models are crucial for long-term success. Biased models may inadvertently favor certain demographics, which can lead to a damaging brand reputation and missed opportunities. We add checks and balances throughout the data lifecycle—from initial collection and model building to real-time validation. Ethical data usage is not only a moral imperative but a strategic advantage. Businesses that proactively address these issues foster stronger customer loyalty, reduced regulatory risks, and a healthier organizational culture. Additionally, ethical oversight encourages more accurate predictive models. By ensuring every dataset is accurate, diverse, and representative, the models become more reliable, and the decisions derived from them hold true under scrutiny. In short, acknowledging the ethical dimension is central to building a sustainable analytics practice that benefits not just the bottom line, but all stakeholders.
Conclusion: The Ever-Evolving Future of Data
Reaching the summit of predictive decision-making doesn’t signal the end of the journey. Much like technology itself, your data strategies need continuous refinement, agile thinking, and regular re-evaluation to remain effective. Business landscapes evolve, consumer preferences shift, and new data sources arise every day. By embracing an iterative, flexible approach, your organization can capitalize on these shifts rather than be disrupted by them. Over time, your analytics endeavors will expand beyond descriptive snapshots of the past, transforming into dynamic models that anticipate next moves and adapt to changes on the fly.
Our consulting team has guided numerous organizations along this path—each client’s story is unique, but the underlying principle is universal: when you shift from gut-driven decisions to data-driven insights, you equip every unit of your business to learn faster and respond smarter. Whether it’s setting up a new pipeline to capture hitherto untracked social data, scaling your predictive models, or exploring how to ethically manage sensitive information, the possibilities are boundless. By following a thoughtful roadmap—data identification, consolidation, cleansing, modeling, and ethical oversight—organizations develop an analytics infrastructure built to last. If you’re ready to accelerate that transition, we’re here to serve as your technical strategist, innovation partner, and guide to achieving sustainable success. Embrace analytics as a strategic imperative, and watch as your business decisions evolve from educated guesses into predictive intelligence.
“Zombie Data” lurks in the shadows—eating up storage, bloating dashboards, slowing down queries, and quietly sabotaging your decision-making. It’s not just unused or outdated information. Zombie Data is data that should be dead—but isn’t. And if you’re running analytics or managing software infrastructure, it’s time to bring this data back to life… or bury it for good.
What Is Zombie Data?
Zombie Data refers to data that is no longer valuable, relevant, or actionable—but still lingers within your systems. Think of deprecated tables in your data warehouse, legacy metrics in your dashboards, or old log files clogging your pipelines. This data isn’t just idle—it’s misleading. It causes confusion, wastes resources, and if used accidentally, can lead to poor business decisions.
Often, Zombie Data emerges from rapid growth, lack of governance, duplicated ETL/ELT jobs, forgotten datasets, or handoff between teams without proper documentation. Left unchecked, it leads to higher storage costs, slower pipelines, and a false sense of completeness in your data analysis.
Signs You’re Hosting Zombie Data
Most teams don’t realize they’re harboring zombie data until things break—or until they hire an expert to dig around. Here are red flags:
Dashboards show different numbers for the same KPI across tools.
Reports depend on legacy tables no one remembers building.
There are multiple data sources feeding the same dimensions with minor variations.
Data pipelines are updating assets that no reports or teams use.
New employees ask, “Do we even use this anymore?” and no one has an answer.
This issue often surfaces during analytics audits, data warehouse migrations, or Tableau dashboard rewrites—perfect opportunities to identify what’s still useful and what belongs in the digital graveyard.
The Cost of Not Acting
Zombie Data isn’t just clutter—it’s expensive. Storing it costs money. Maintaining it drains engineering time. And when it leaks into decision-making layers, it leads to analytics errors that affect everything from product strategy to compliance reporting.
For example, one client came to us with a bloated Tableau environment generating conflicting executive reports. Our Advanced Tableau Consulting Services helped them audit and remove over 60% of unused dashboards and orphaned datasets, improving performance and restoring trust in their numbers.
Zombie Data doesn’t die on its own. You have to hunt it.
How to Identify Zombie Data
Track Usage Metrics
Most platforms offer metadata APIs or usage logs. Tableau, Power BI, Snowflake, and PostgreSQL all provide access to view/query-level metrics. Start by filtering out unused dashboards, views, tables, or queries over the past 90+ days.
Build an Inventory
Create a centralized inventory of all data assets: dashboards, datasets, views, schemas. Mark them as active, questionable, or deprecated based on access logs, ownership, and business context.
Talk to the Humans
Automation only gets you so far. Schedule short interviews with report consumers and producers. Ask what they actually use, what feels duplicated, and what doesn’t serve any purpose anymore.
Visualize Dependencies
Use tools or scripting to trace lineage. Our Data Engineering Consulting Services often include mapping dependency chains to identify upstream pipelines and unused downstream nodes.
Search for Data Drift
Zombie Data often doesn’t update correctly. Build alerting mechanisms to flag stale tables, schema mismatches, or declining data quality metrics.
How to Remove It Safely
Once you’ve tagged the suspects, here’s how to bury them:
Archive Before Deleting
Push to long-term, cold storage before outright deletion. This gives you a buffer if someone realizes they need it… after it’s gone.
Communicate Across Teams
Notify impacted teams before removing anything. Zombie Data has a habit of being secretly critical to legacy processes.
Automate and Document
Build scripts that deprecate and archive unused datasets on a regular cadence. Document decisions in a central location—especially in shared BI tools.
Set Retention Policies
Not all data needs to live forever. Implement retention logic based on business needs and compliance, and automate expiration when possible.
Ongoing Prevention
Zombie Data is a recurring problem unless you implement a culture of data hygiene. That means regular audits, ongoing governance, and tight integration between engineering and analytics teams.
Teams working with platforms like MySQL, PostgreSQL, or Node.js-backed ETL pipelines can prevent zombie data from spawning by introducing data validation layers and robust logging—areas where our MySQL Consulting Services and backend solutions have helped clients automate their cleanup processes long-term.
Final Thoughts
Zombie Data is the silent killer of modern analytics maturity. It’s easy to ignore, tricky to find, and dangerous when left unchecked. But with the right tools, strategy, and a bit of curiosity, any team can begin the cleanup process and reclaim performance, accuracy, and trust in their data systems.
If you’re seeing signs of Zombie Data in your ecosystem, it might be time to bring in a fresh pair of eyes. Whether it’s through analytics audits, warehouse cleanups, or dashboard rewrites—removing the undead from your stack is one of the fastest ways to improve clarity, speed, and strategic impact.
—
Need help auditing your data ecosystem? Let’s talk about how we help organizations remove noise and unlock clarity with real-time advanced analytics consulting.
In the ever-evolving world of data architecture, decision-makers are often faced with a foundational choice: ETL (Extract, Transform, Load) or ELT (Extract, Load, Transform)? For years, ETL was the gold standard—especially when on-prem systems and batch processing dominated the landscape. But as cloud computing, real-time analytics, and modern data stacks surged, so did the practical advantages of ELT.
This post explores real-world scenarios where ELT didn’t just work—it outperformed traditional ETL by a wide margin. These insights are for teams stuck at the crossroads of modernizing their stack, scaling operations, or simply tired of overcomplicating their data pipelines.
Use Case 1: Real-Time Data Visibility for Marketing Dashboards
A global marketing firm approached our team with a common problem: delays in reporting. Their ETL process took over 8 hours to run, rendering “daily” dashboards outdated before stakeholders even opened them.
By shifting to ELT, we pushed raw data into a cloud warehouse as it was created—no waiting. From there, lightweight transformations inside the warehouse made it possible to update dashboards in near-real-time.
This switch drastically improved executive visibility and marketing agility. Visualizing this shift was only made possible through a smarter data foundation, powered by our data engineering consulting services in Austin, Texas. The decision to transform data after loading it gave teams the flexibility to run multiple transformation versions and improve queries without touching upstream logic.
Use Case 2: Enabling Advanced Analytics in Healthcare
Healthcare providers are under immense pressure to turn data into actionable insights, fast. In one scenario, a client with strict HIPAA compliance rules needed to merge EHR data from various sources to identify trends in patient outcomes.
Previously, their ETL toolset struggled with data volume, versioning issues, and schema changes. Our team moved them to an ELT architecture, which loaded all raw data into a secure cloud environment and executed transformations using SQL-based logic—directly within the warehouse.
The result? Analytics teams were empowered to iterate faster, adapt to regulatory changes, and produce more accurate models using services like our advanced analytics consulting services in Texas. Because the raw data was always available, models could be retrained or compared against historical versions instantly—something traditional ETL couldn’t support without redesign.
Use Case 3: Agile Product Analytics with Tableau
An e-commerce client needed to understand how product features impacted user engagement, but their ETL processes were rigid and hardcoded. Every schema change required days of rework, blocking fast experimentation.
We introduced a cloud-native ELT approach that funneled all user interaction logs into their warehouse continuously. With the data already accessible, business analysts could use advanced Tableau consulting services in Texas to explore metrics in real time, apply custom calculations, and even test hypotheses without involving engineering.
This dramatically improved how fast teams could respond to product performance questions, iterate on UX experiments, and deliver reports that aligned with rapidly changing business priorities. It wasn’t just faster—it was finally scalable.
Why ELT Wins in the Cloud Era
The shift to ELT is not about replacing ETL everywhere—it’s about knowing when to use the right tool for the job. ELT thrives when:
Data volume is high
Schema evolution is frequent
Real-time insights are critical
Multiple teams need access to raw or semi-processed data
You want analytics to evolve without changing core logic upstream
These advantages are amplified when paired with robust warehouse technologies like Snowflake, BigQuery, or Redshift. ELT enables data engineers to build scalable pipelines, analysts to iterate quickly, and business leaders to make informed decisions faster.
It’s More Than a Trend—It’s a Strategy
Many organizations hear “ELT” and assume it’s just another buzzword. But as the above use cases show, it’s a strategic advantage when deployed correctly. ELT doesn’t just streamline the data journey—it creates room for innovation.
If your team is still stuck debating whether to move to ELT, it might be time to explore your current bottlenecks. Are your reports always delayed? Are schema changes dragging down your entire dev cycle? Is your warehouse underutilized? These are signs that an ELT-centric approach may unlock the performance you’ve been chasing.
Our team at Dev3lop has helped companies across industries migrate to modern data stacks with ELT at the center. Whether it’s integrating with Tableau, Power BI, or MySQL consulting services and other backend systems, our software innovation approach is built to scale with your growth.
In the age of data overload and attention scarcity, ELT isn’t just faster—it’s smarter.
If you’re ready to rethink how your business handles data transformation, now’s the time to explore solutions that scale with you—not against you.