Split url to columns using Google Sheets
The fast way to Split URL to Columns using Google Sheets.
If you’re a technical expert, here’s all you need to know to split text to columns in google sheets.![]()
- Shortcut keys = ctrl+alt+d, E, arrow keys up and down select between the options, enter.
If you’re not as technical and prefer a broken out explanation with screenshots, read below.
If you want to be guided more and things explained, keep reading.
We explain how we get the URLs automated, and share the exact logic used to do it below. In our 11 step tutorial.
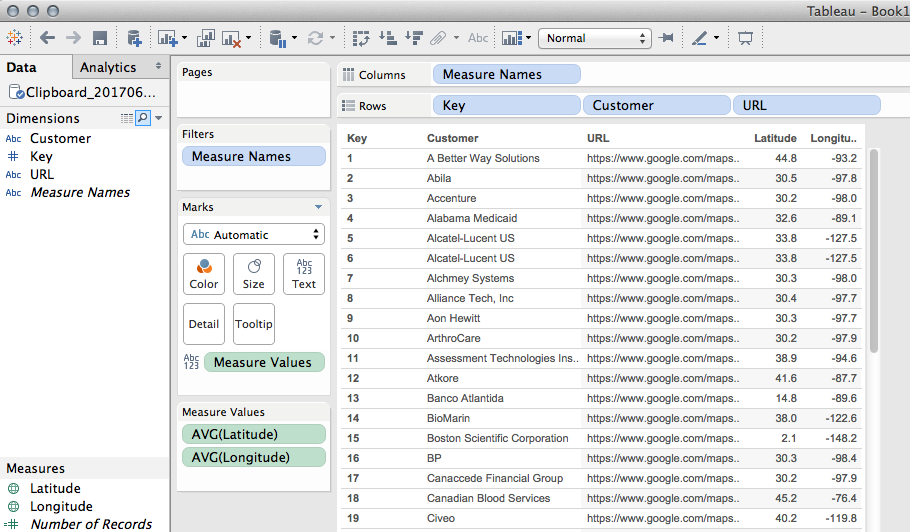
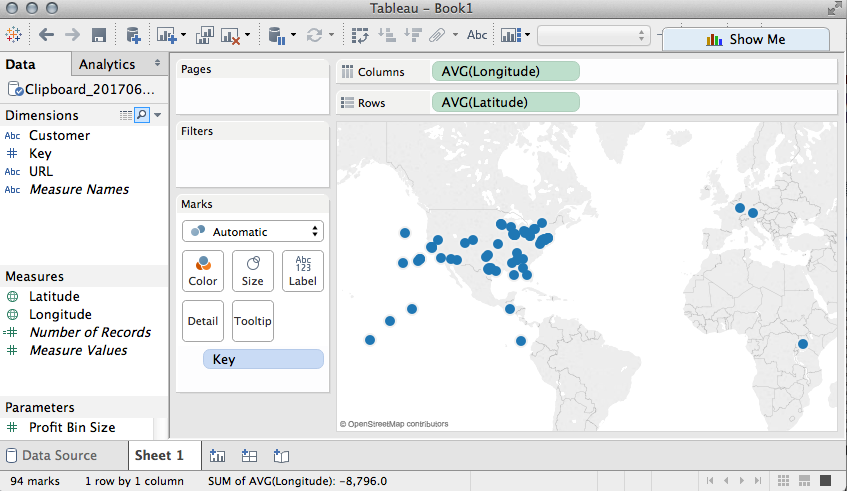
The use case is we have 100+ URLs with coordinates from a previous lesson.
Split URL to Columns in 11 easy steps.
Let’s use Google Sheets Split Url to Columns function now!
- Left-click the column header with URLs
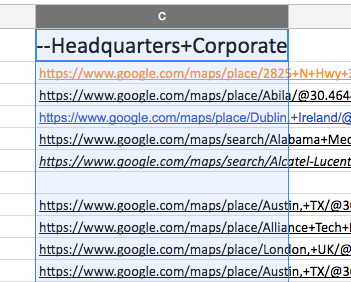
Left click above –Headquarters, to select ‘C’ the column header that contains URLs to split.
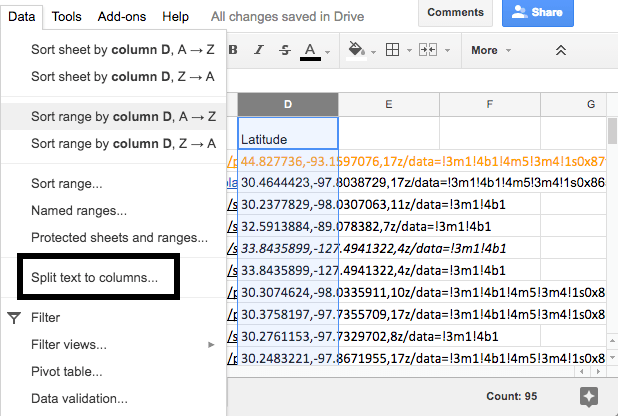
- Left click Data, Ctrl+Alt+D or Ctrl+Option+D,
- Left click Split text to columns… or E
Split text to columns on Google Sheets is extremely powerful for manual manipulation of a table of data.
- On the bottom of your browser – you’ll see a subtle menu. If you have a big screen, you could miss this at first! Google Sheets natively uses comma separator.
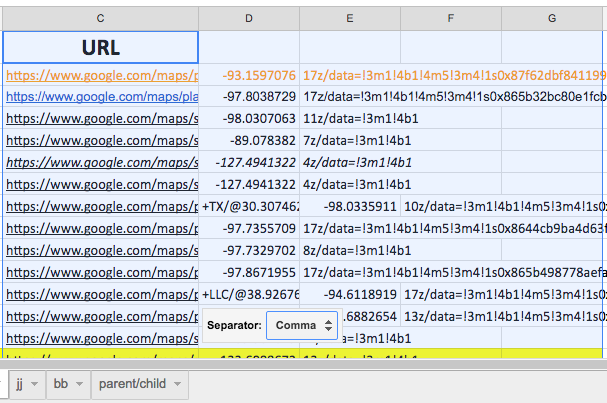
We bring our browser window into a smaller vertical box, otherwise this Separator: Comma drop-down may be hard to see at first. Left click Comma to activate the drop Split text to column Dropdown.
- Left click Custom to open the wild card Split text to column finder.
- Type @ to separate by a character or many.
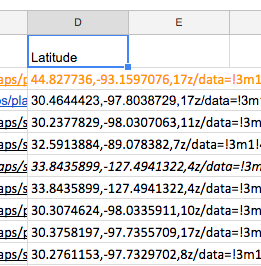
- Copy – Latitude – and paste it in column D header.
- Left click column D to select the entire column of Latitude, Longitude, etc….

Left-click the column header to select the entire column.
- Left click Data, Left click Split Text to columns… (Refer to Step 4 screenshot above)
- Use Custom for the separator, and leave it set to default comma.
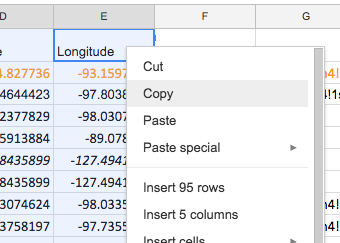
- Copy – Longitude – paste that to Column E.
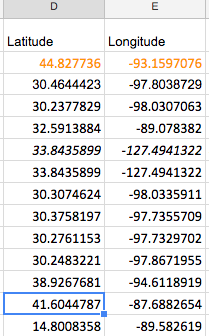
Latitude and Longitude have been split from a Google Maps Url copy paste.
Split URL to Columns in Google Sheets
Splitting text into columns is amazing if you want to avoid spending money to get coordinates.
Google Sheets offers a two-click win, 1 type win.
If you need any help with it, please comment below.
Saving time by macro-ing and using google sheets split text to columns function.
Stacking solutions are critical, we prefer KNIME, however this blog covers how to use Google sheets effectively.
We help some companies compute trillions of records using our Knime Consulting and Alteryx consulting expertise.
Enjoy!